Spring Forecast of Economic Trends 2026: economic growth to strengthen amid gradual export sector recovery and rising private consumption; currently heightened geopolitical uncertainty
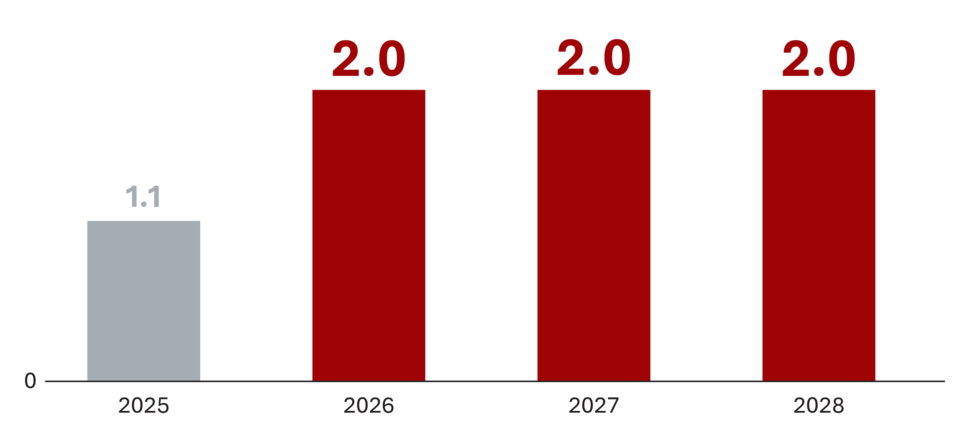
Under the baseline scenario, which does not assume persistently elevated oil and gas prices or disruptions to their supply, economic growth in Slovenia is projected to strengthen to 2.0% this year – broadly in line with the autumn forecast – assuming the anticipated growth in external demand. A similar pace…
Charts of the week from 2 to 6 March 2026: real exports and imports of goods, unemployment
Following growth in the fourth quarter of last year, goods exports remained broadly unchanged at the beginning of this year, while imports declined significantly. Owing to the high base in January last year, both exports and imports were considerably lower year-on-year. The number of unemployed persons…
Government reappoints Alenka Kajzer as Acting Director of the Institute of Macroeconomic Analysis and Development
At its session today, the Government of the Republic of Slovenia reappointed Alenka Kajzer as Acting Director of the Institute of Macroeconomic Analysis and Development of the Republic of Slovenia, effective 6 March 2026, until the appointment of a new…
Charts of the week from 16 to 20 February 2026: gross domestic product, number of persons in employment and average gross wage per employee
GDP grew by 1.1% last year, with growth primarily driven by construction investment. Growth in private consumption more than halved, while growth in government consumption also moderated. The contribution of external…
National productivity board
IMAD analyses productivity and competitiveness as the national productivity board
GDP and prices
GDP growth is projected to strengthen to 2.0% this year (from 1.1%), broadly in line with autumn’s expectations. The export sector will gradually recover, supported by improved prospects for industrial production in Slovenia’s main trading partners. Investment activity will continue to expand, driven primarily by public investment. Growth in private consumption will strengthen this year alongside further increases in real disposable income. Inflation this year (2.6% at year-end) is expected to remain similar to last year, amid above-average growth in services and food prices.
Labour market
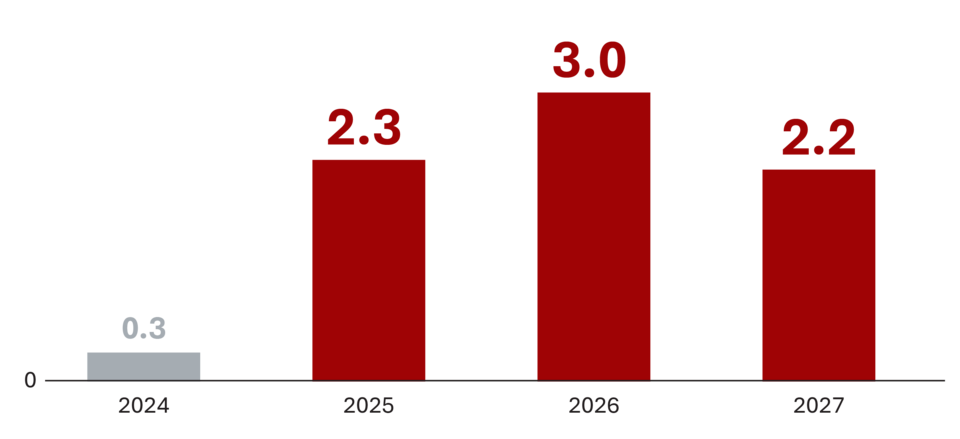
Employment is expected to stagnate due to limited labour supply, while unemployment will remain low. Wage growth will be higher this year than last (6.7% in nominal terms; 6.5% in the public sector and 6.7% in the private sector). Growth will be particularly pronounced in the private sector, where last year’s slowdown was largely statistical (extra payments were significantly reduced following the introduction of the winter bonus, which is not included in wage growth).
International trade
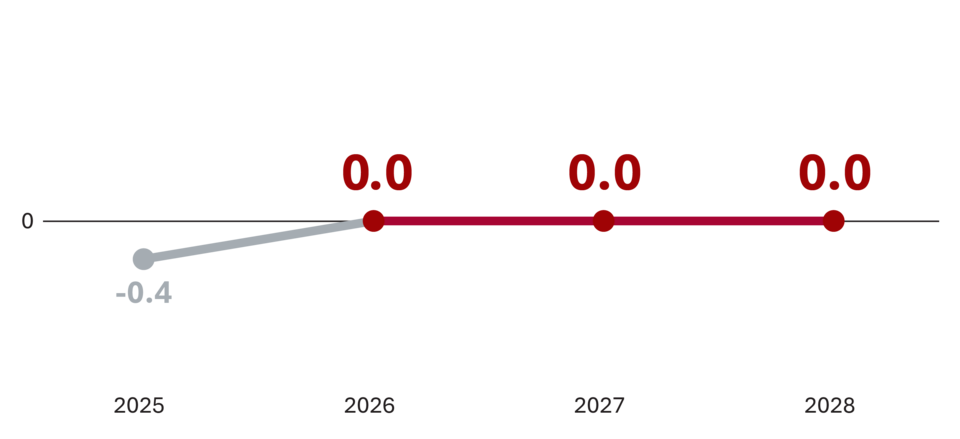
Growth in exports of goods and services is projected to strengthen this year. Goods export growth will be supported by the recovery of industrial production in Slovenia’s trading partners, investment in the pharmaceutical industry, the launch of production of a new car model, and a higher number of working days. Growth in services exports will also increase. Amid moderate growth in domestic demand, import growth will outpace export growth. As a result, the current account surplus will narrow, reflecting a widening deficit in trade in goods.
IMAD
The Institute of Macroeconomic Analysis and Development of the Republic of Slovenia is an independent government office.
The Institute performs the following tasks:
- it monitors and analyses current trends and development in its economic, social and environmental dimensions;
- it monitors and analyses the achieving of the development objectives of the country;
- it prepares macroeconomic forecasts and other expert groundwork that serve as the basis for budgetary planning and formulating economic policy measures;
- it analyses productivity and competitiveness as the national productivity board;
- it carries out research work.