
Charts of the Week
Charts of the week from 14 to 18 September 2026: number of persons in employment, activity in construction and current account of the balance of payments
In July, the number of persons in employment remained broadly unchanged compared with both previous months and a year earlier. However, developments continued to vary considerably across activities. Year-on-year, the number of persons in employment increased mainly in health and social work activities, while declines were recorded particularly in trade, manufacturing, and administrative and support service activities. Construction activity in July remained at the level recorded in the second quarter, while year-on-year growth slowed considerably amid a high base from last year (particularly in civil engineering). Construction prices continued to rise markedly. The 12-month current account surplus (to July) was slightly lower year-on-year, mainly due to the goods balance shifting into deficit and the widening of the secondary income deficit.
Number of persons in employment, July 2026
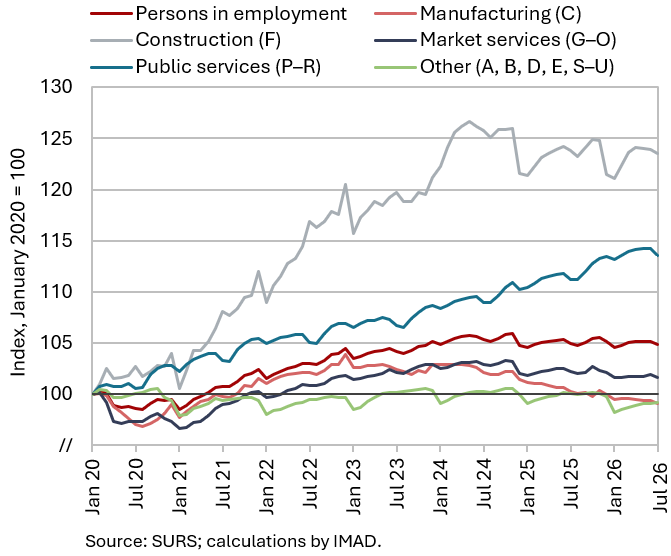
According to the Statistical Register of Employment (SRDAP), the number of persons in employment in July remained broadly unchanged relative to previous months (seasonally adjusted) and a year earlier. The number of persons in employment declined slightly year-on-year (–0.2%), while the number of self-employed persons increased (0.9%). Despite the relatively stable overall number of persons in employment, considerable differences across activities persist. The largest year-on-year declines were recorded in administrative and support service activities (–1.4%), trade (–1.4%) and manufacturing (–1.2%), while growth was recorded in public services (2.1%), particularly in health and social work activities (3.4%). The number of foreign citizens in employment increased by 2.9% year-on-year in July, while the number of Slovenian nationals in employment declined by 0.6%, primarily due to retirements.
Activity in construction, July 2026
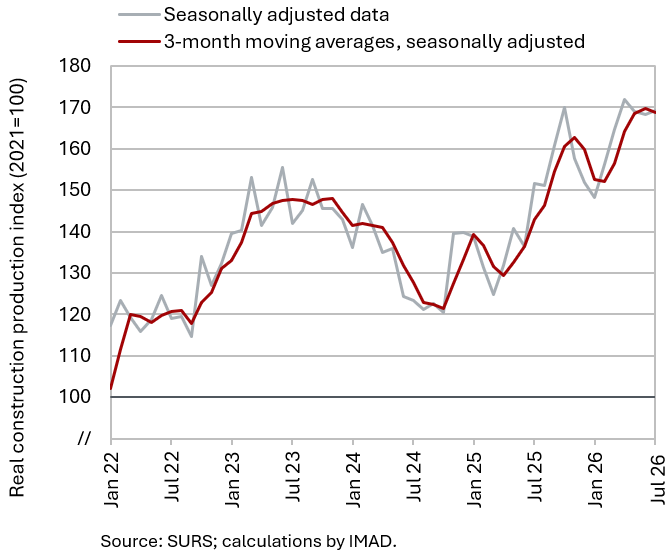
In July, the value of construction put in place remained at the level recorded in the second quarter, while its year-on-year increase was considerably lower than in the first half of the year. Following strong growth at the beginning of the year, the value of construction put in place in July remained at the level recorded in the second quarter (seasonally adjusted). Owing to the strong acceleration in construction activity in the second half of last year, the year-on-year increase in July was considerably lower (12%) than in the first half of the year, when the value of construction work was 23% higher than in the same period last year. The slowdown was most pronounced in civil engineering, where the value of construction put in place was only 5% higher in July than a year earlier.
This year, construction prices have again risen markedly year-on-year. The implicit deflator of the value of construction put in place (which measures price developments in construction) rose to 6.8% in July, its highest rate since the beginning of 2023. Year-on-year growth in the construction producer price index was even stronger, reaching 8.6% in the second quarter (the latest available data). Both indicators suggest that, amid labour shortages, higher material and energy costs and, above all, favourable market conditions (strong demand), companies are raising their prices more rapidly.
Current account of the balance of payments, July 2026
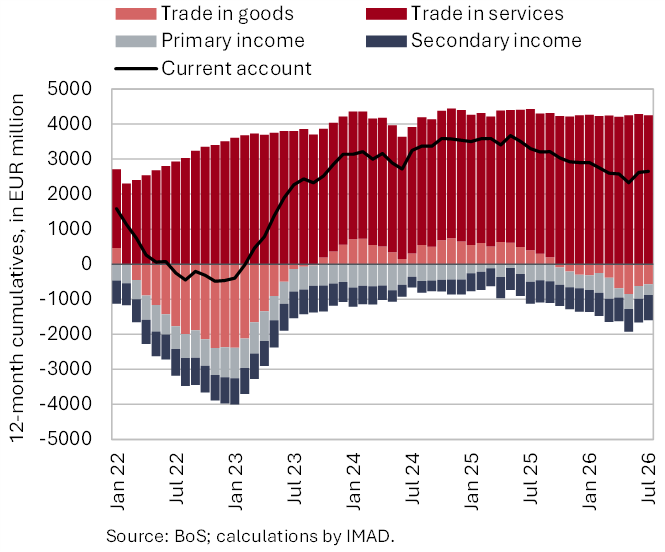
The 12-month current account surplus (to July) decreased by EUR 0.6 billion compared with the preceding 12-month period, amounting to EUR 2.7 billion (3.5% of estimated GDP). The decline was mainly attributable to the goods deficit and a wider secondary income deficit. The goods balance shifted into deficit as import growth outpaced export growth. Import prices declined year-on-year from May 2023 to March 2026, but increased year-on-year from April to July this year. In real terms, imports increased by 5.6% year-on-year in the last 12 months (6.8% in nominal terms), while exports rose by 3.5% (4.4% in nominal terms). The widening of the secondary income deficit was mainly attributable to higher payments to the EU budget based on gross national income and value added tax. The services surplus increased further, mainly in trade in insurance and transportation services. The primary income deficit narrowed due to lower net outflows of income from equity capital (dividends and profits).