Charts of the Week
Charts of the week from 7 to 11 July 2025: production volume in manufacturing and electricity consumption by consumption group
Following a contraction earlier in the year, manufacturing output increased in May, across most groups of industries by technological intensity. In the first five months, it was 2% lower year-on-year. Industrial electricity consumption, which can serve as an indicator of economic activity, was slightly higher year-on-year in June (0.7%).
Production volume in manufacturing, May 2025
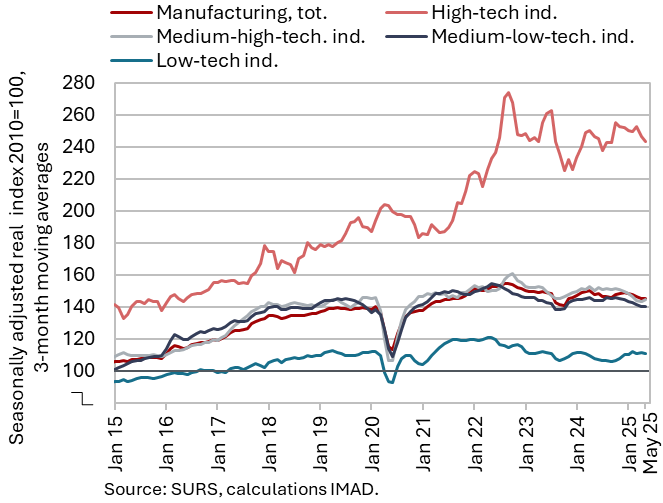
Manufacturing output, which had contracted earlier in the year, increased in May (by 0.7%, seasonally adjusted); in the first five months, it was 2.0% lower year-on-year (working-day adjusted). On a monthly basis, output strengthened across most industry groups by technological intensity, declining slightly only in medium-high-technology industries (seasonally adjusted). Over the first five months, output in this group was on average 4.5% lower than in the same period last year, primarily due to a decline in the manufacture of motor vehicles and other transport equipment. Output in the manufacture of machinery and equipment n.e.c. was also slightly lower year-on-year. Output in the energy-intensive chemical industry remained higher than a year earlier, and, following a decline in 2024, the manufacture of non-metallic mineral products was also higher year-on-year. In other energy-intensive industries, however, output declined slightly after having increased in 2024. Output also declined in certain low-technology industries (most notably leather manufacturing) and in medium-low-technology manufacture of fabricated metal products. Output in high-technology industries remained higher year-on-year, in our assessment primarily due to growth in the pharmaceutical industry. The confidence indicator in manufacturing declined slightly further in June. Compared with the first quarter, particularly the overall order books indicator was lower, and it also declined year-on-year – as did the indicator of expected production.
Electricity consumption by consumption group, June 2025
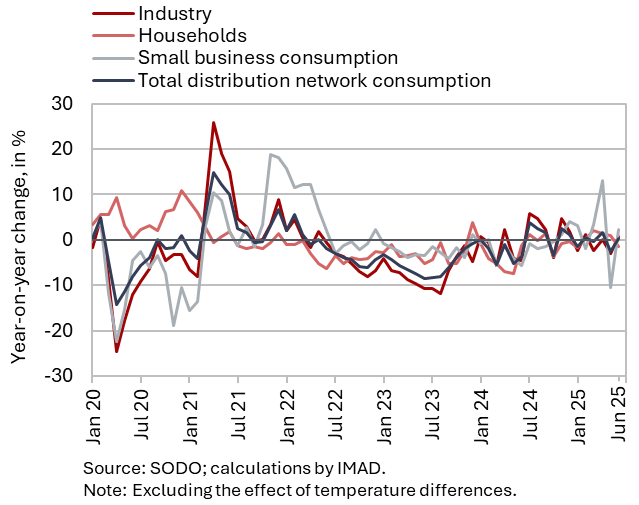
Electricity consumption in the distribution network was similar in June than in the same month last year. With one more working day this June, industrial consumption, which can serve as an indicator of economic activity, increased slightly year-on-year (0.7%). Household consumption was 1.4% lower year-on-year, while small business consumption – which accounts for only a small share of total consumption – was 2.2% higher.