Charts of the Week
Charts of the week from 24 to 28 November 2025: consumer prices, economic sentiment, turnover in trade and other charts
Year-on-year growth in consumer prices in November fell to its lowest level since June, with food and non-alcoholic beverages remaining the largest contributors to overall inflation. The economic sentiment indicator strengthened further in November and, for the first time in three years, rose above its long-term average. Real turnover in most retail trade segments declined in the third quarter compared with the second, while sales across all trade segments were higher year-on-year in the first nine months. Real turnover in market services increased in current terms in most activities in the third quarter and was also higher year-on-year in most activities in the first nine months. The survey unemployment rate decreased again year-on-year in the third quarter, while the number of persons in employment increased, mainly due to transitions out of inactivity.
Consumer prices, November 2025
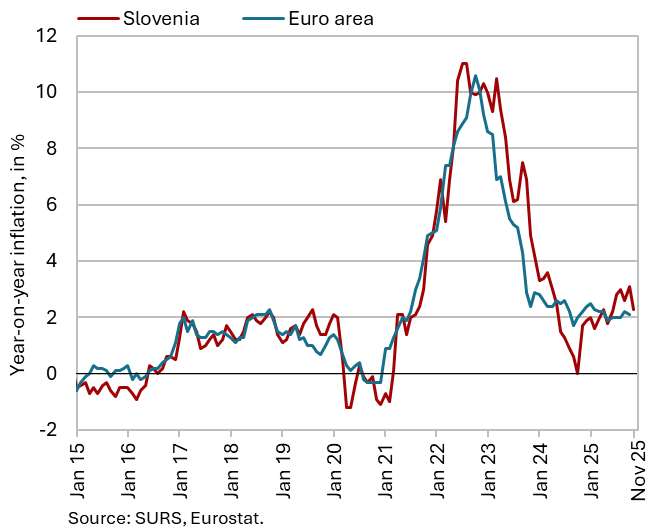
Consumer prices remained unchanged at the monthly level in November for the second consecutive month, while the year-on-year increase slowed to 2.3% (from 3.1% in October). The lower year-on-year inflation since June, was driven primarily by a slower increase in prices of food and non-alcoholic beverages, where the year-on-year growth declined from 6.8% in October to 5.0% (the lowest since March this year), amid a 0.9% month-on-month decrease. Prices in this group therefore no longer record the fastest growth among all 12 CPI groups, but they still contribute the most (0.9 p.p.) to inflation. Prices in the health group recorded a higher year-on-year increase this time (5.1%). Prices of semi-durable goods remained unchanged year-on-year. Following modest growth over the past five months (ranging between 0.1% and 0.6%), prices of durable goods were again lower year-on-year in November (by 0.4%). Year-on-year growth in service prices (2.7%) remained largely unchanged.
Economic sentiment, November 2025
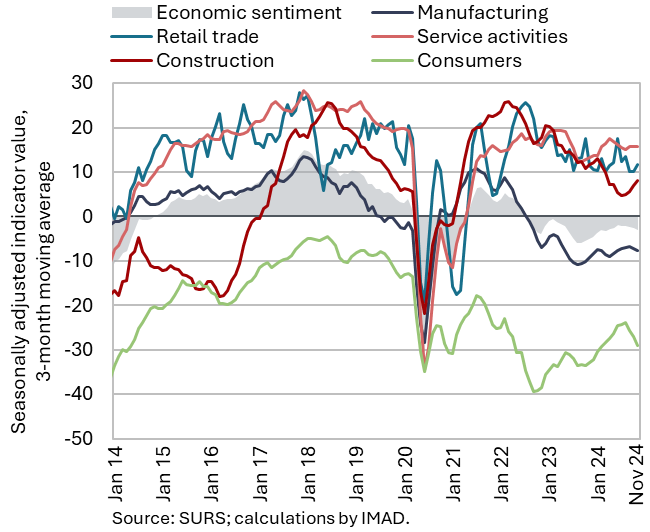
The value of the economic sentiment indicator improved in November for the fifth consecutive month and was also higher year-on-year. The values of the consumer and construction confidence indicators increased month-on-month, the confidence indicator in manufacturing stagnated, while the indicators in retail trade and in services declined slightly. The same applies to the year-on-year comparison. The economic sentiment indicator exceeded its long-term average for the second consecutive month (after nearly three years). Among individual sectors, only the confidence indicators in construction and in services are currently above their respective long-term averages.
Turnover in trade, September 2025
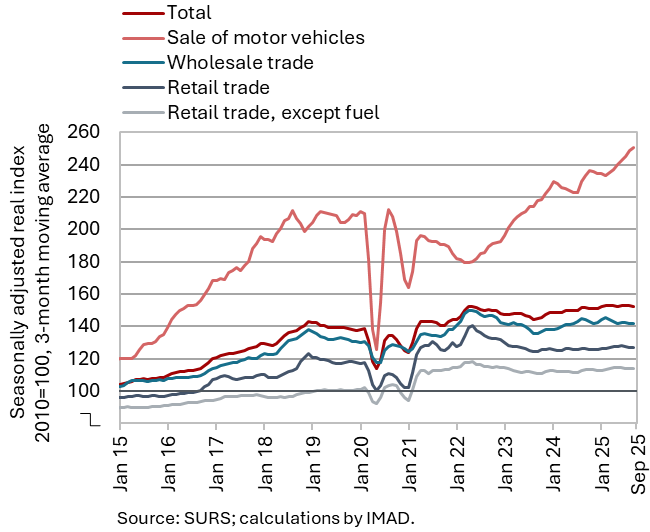
Turnover in most trade sectors declined in the third quarter compared with the second (seasonally adjusted). In wholesale trade, turnover contracted for the second consecutive quarter and, for the first time since the beginning of 2024, was also lower year-on-year. Turnover in retail trade with food products also declined year-on-year, having recorded weak growth in the second quarter and a decline in the third. Turnover in retail trade with non-food products remained broadly unchanged relative to the second quarter (when it had increased) and was higher year-on-year. In the sale of motor vehicles, relatively strong turnover growth persisted. Across all trade sectors, sales were higher year-on-year in the first nine months of the year. Growth in the sales of motor vehicles was robust (7%), while in other trade sectors it was modest (averaging around 1%).
Turnover in market services, September 2025
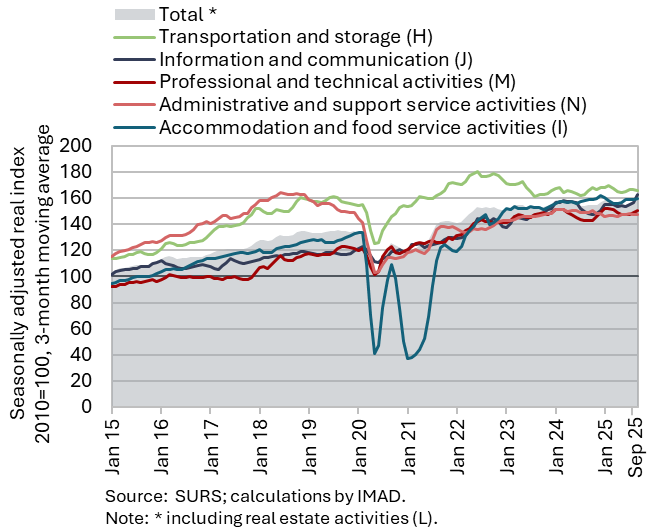
Total real turnover in market services increased sharply in the third quarter compared with the second (by 2.8%, seasonally adjusted) and also strengthened year-on-year (by 2.5%). Following growth in the first half of the year, turnover increased markedly in current terms in information and communication. Growth stemmed primarily from higher sales of computer services on the domestic market. Relatively strong turnover growth was also recorded in professional and technical activities, where turnover had declined in the first half of the year. After two quarters of decline, turnover in transportation and storage also increased slightly, also in both main activities – land transport and storage. Accommodation and food service turnover rose somewhat for the second consecutive quarter. In administrative and support service activities, the stagnation in turnover observed in the first half of the year persisted, primarily due to the continued contraction of turnover in employment services. In the first nine months of 2025, administrative and support service activities was the only activity with a year-on-year decrease in real turnover.
Active and inactive population, Q3 2025
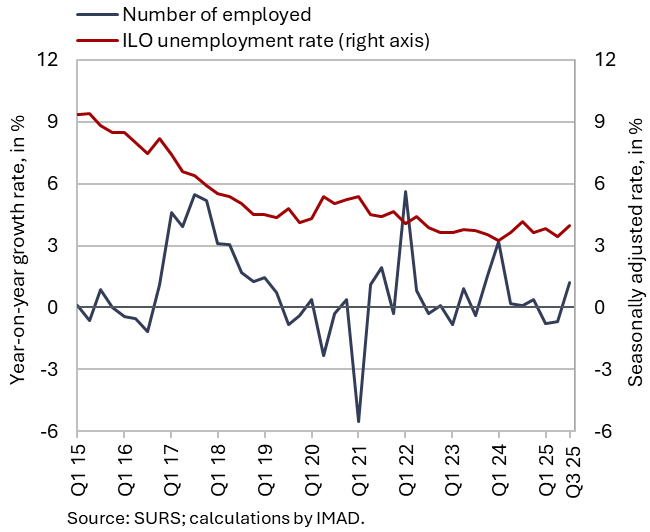
According to survey data, the number of unemployed declined year-on-year in the third quarter, while the number of persons in employment increased. According to survey data, 44 thousand persons were unemployed, which is 4.3% less than in the third quarter of last year. The survey unemployment rate (4.2%) fell year-on-year (by 0.2 p.p.). The number of persons in employment was higher year-on-year in the third quarter (1.2%), mainly as a result of transitions out of inactivity. Compared with a year earlier, the number of employees in employment relationship and student workers increased, while the number of self-employed persons and employees engaged in certain other forms of work (contract work, work for direct payment, apprentices) as well as unpaid family workers declined.