Charts of the Week
Charts of the week from 3 to 7 November 2025: unemployment, exports and imports of goods, turnover in trade
The number of registered unemployed persons, which again rose slightly in October (by 0.2%, seasonally adjusted), increased by 0.5% year-on-year. The number of long-term unemployed and unemployed persons aged over 50 remained lower than a year earlier, while the number of unemployed young people increased. Real exports of goods increased in the third quarter, driven by growth in July, while imports remained broadly unchanged from the second quarter (seasonally adjusted). In the first nine months, exports declined slightly year-on-year, while imports increased by 0.7%. In most trade sectors, average turnover in July and August was lower than in the second quarter (seasonally adjusted). It continued to increase only in the sales of motor vehicles, where it was 7% higher year-on-year in the first eight months. In other trade sectors, year-on-year growth was more modest, averaging below 1%.
Unemployment, October 2025
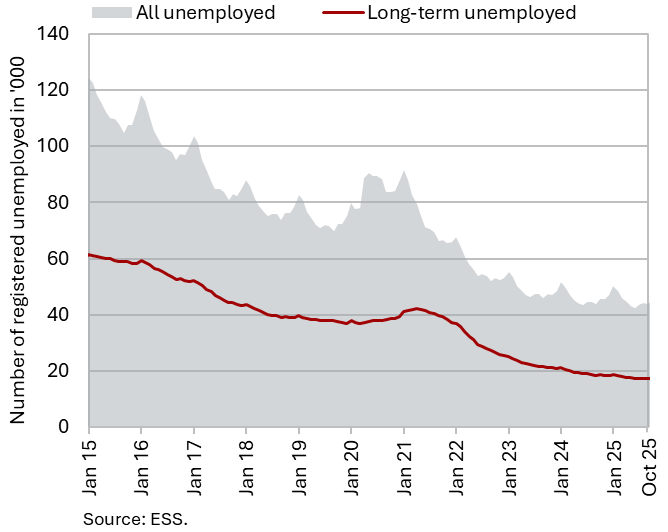
The number of registered unemployed persons continued to increase slightly in October (by 0.2%, seasonally adjusted). According to original data, 45,670 people were unemployed at the end of October, 3.9% more than at the end of September. This largely reflects seasonal trends related to a higher inflow of first-time job seekers into unemployment upon completion of the academic year. Year-on-year, the number of unemployed was 0.5% higher, which is largely due to the increased inflow of first-time jobseekers into unemployment since July this year as a result of a higher inflow of foreign nationals with temporary protection status into the unemployment register, and partly also to cyclical developments. The year-on-year declines in long-term unemployment (–6.7%) and in unemployment among persons aged 50 and over (–7.6%) were similar to previous months. Since the end of last year, the number of unemployed young people (aged 15–29) has been above the level recorded a year earlier (in October, it was up 8.3% year-on-year).
Exports and imports of goods, September 2025
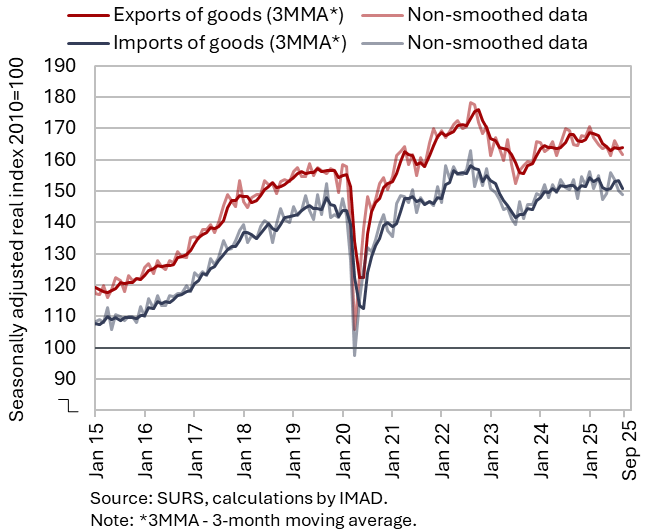
In the third quarter of 2025, real exports of goods increased compared with the previous quarter, while imports remained broadly unchanged (seasonally adjusted); on a year-on-year basis, both exports and imports declined. The quarterly growth in exports (0.5%) was primarily driven by a strong increase in July, followed by declines in August and September. In the third quarter, exports to EU Member States rose, while exports to non-EU markets decreased, most notably to the United States. Exports of road vehicles increased markedly, with this category typically exhibiting pronounced monthly and quarterly volatility, particularly exports to France. Exports of pharmaceutical products and other machinery and equipment also strengthened. After a sharp decline in the previous quarter, exports of metals and metal products also edged up slightly, while exports of other materials decreased. On the import side (up 0.1%), imports of consumer and capital goods rose month-on-month, while imports of intermediate goods declined for the second consecutive quarter (all seasonally adjusted). Year-on-year, exports and imports in the third quarter decreased (by 2.2% and 0.3% respectively), partly due to a higher base last year. In the first nine months of this year, exports fell by 0.4%, while imports increased by 0.7%.
Goods exports continue to be constrained by weak demand in manufacturing sectors of Slovenia’s key trading partners, as export order books also remain subdued. Also at the beginning of the fourth quarter, companies cited uncertain economic conditions and weak domestic and foreign demand among the main factors limiting activity in manufacturing.
Turnover in trade, August 2025
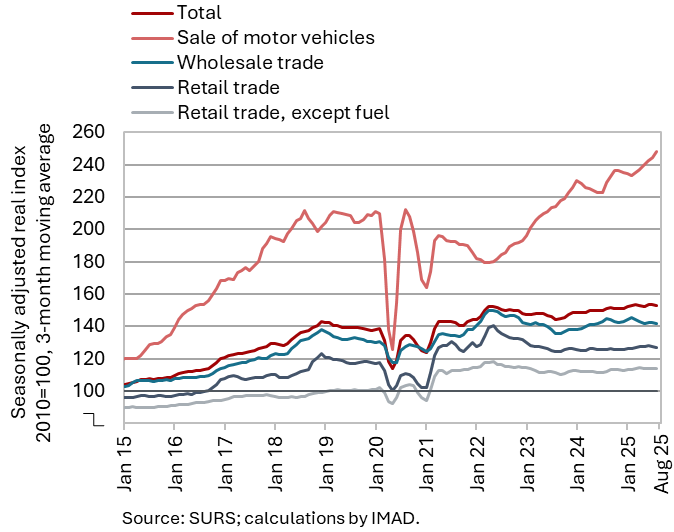
Turnover in trade was, on average, lower in July and August than in the second quarter (seasonally adjusted), except in motor vehicle sales. Turnover in wholesale trade, which had already declined in the second quarter, continued to fall in July and August and was lower year-on-year for the second consecutive period. Turnover in retail trade with food products also fell year-on-year, having decreased on average in July and August after weak growth in the second quarter. Turnover in retail trade with non-food products was, after growth in the first two quarters, slightly lower on average in July and August, but remained higher year-on-year. In the motor vehicles sales, turnover growth persisted through the summer months. Across all trade sectors, sales were higher year-on-year in the first eight months of the year. Growth in motor vehicles sales was robust (7%), while it was modest in other trade sectors (on average below 1%).