Charts of the Week
Charts of the week from 9 to 13 February 2026: consumer prices, production volume in manufacturing, activity in construction and other charts
Consumer prices were 2.6% higher in January than a year earlier. The largest contribution to inflation again came from food and non-alcoholic beverages, although price growth in this category continues to moderate gradually. Electricity consumption in the distribution network in January significantly exceeded the level recorded a year earlier, while industrial consumption was 1.2% higher despite one fewer working day. After modest growth in the third quarter, manufacturing output declined in the fourth quarter of last year (seasonally adjusted). In 2025, it contracted by 1.5%, with the largest negative contributions stemming from the metal industry and the manufacture of motor vehicles, trailers, semi-trailers and other transport equipment. Construction activity also edged down at the end of the year (seasonally adjusted), although it remained higher year-on-year. Over 2025 as a whole, it was 10% above its 2024 level. However, certain other data (e.g. VAT data) do not corroborate such robust growth in construction activity. The current account surplus, which had been relatively high in 2023–2024, narrowed last year, primarily reflecting deficits in secondary income and trade in goods.
Consumer prices, January 2026
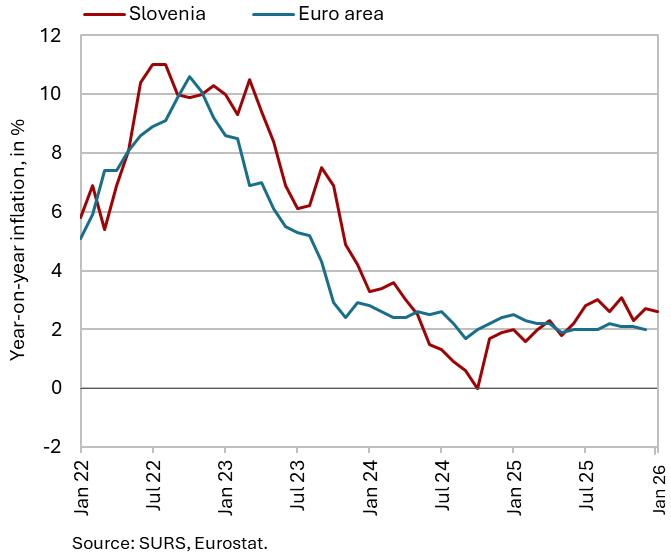
In January 2026, consumer prices were 2.6% higher year-on-year, despite a 0.5% month-on-month decline. Goods prices, which we estimate account for almost 65% of the HICP basket, increased by 2.1% year-on-year, while services recorded more pronounced price growth (3.5%). Both components contributed almost equally to overall inflation (goods: 1.4 p.p; services: 1.3 p.p.). Among the 13 main groups of goods and services, the largest contribution (0.8 p.p.) again came from food and non-alcoholic beverages, where prices were 4.2% higher year-on-year, although price growth in this category continues to moderate gradually. Of all groups, health recorded the highest year-on-year increase (6.3%; December: 5.9%). Price growth for non-energy industrial goods remained subdued. Durable goods prices declined slightly year-on-year (–0.1%). In contrast, growth in semi-durable goods prices accelerated to 2.0%, nearly triple the December 2025 rate, primarily reflecting less pronounced seasonal price reductions in the clothing and footwear group.
Production volume in manufacturing, December 2025
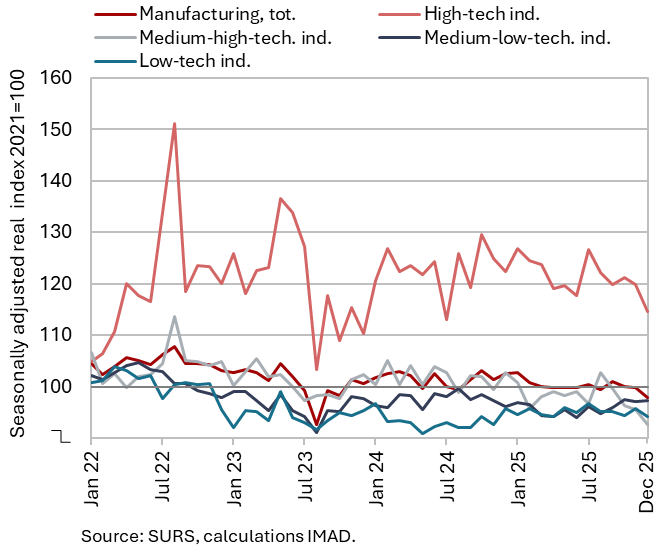
After a modest recovery in the third quarter, manufacturing output declined again in the fourth quarter of 2025 (seasonally adjusted) and was also significantly lower year-on-year (by 2.9%, working-day adjusted). Output declined in most groups classified by technological intensity, with growth maintained only in the medium-low-technology industries (seasonally adjusted), which returned to year-earlier levels by the end of the year. Nevertheless, for 2025 as a whole, output in this group was 1.8% lower than in 2024, primarily due to a pronounced contraction in the manufacture of fabricated metal products. Output in most medium-high- and high-technology industries also lagged behind 2024 levels. The manufacture of motor vehicles recorded the largest decline (by one-tenth) (together with the metal industry, it made the most substantial contribution to the overall 1.5% decrease in manufacturing output in 2025). Among the more technology-intensive industries, only the manufacture of ICT equipment recorded an increase, while the energy-intensive chemicals industry remained broadly at its 2024 level. Output in low-technology industries increased last year (by 2.0%), although this was driven solely by the food and wood-processing industries and other manufacturing.
Activity in construction, December 2025
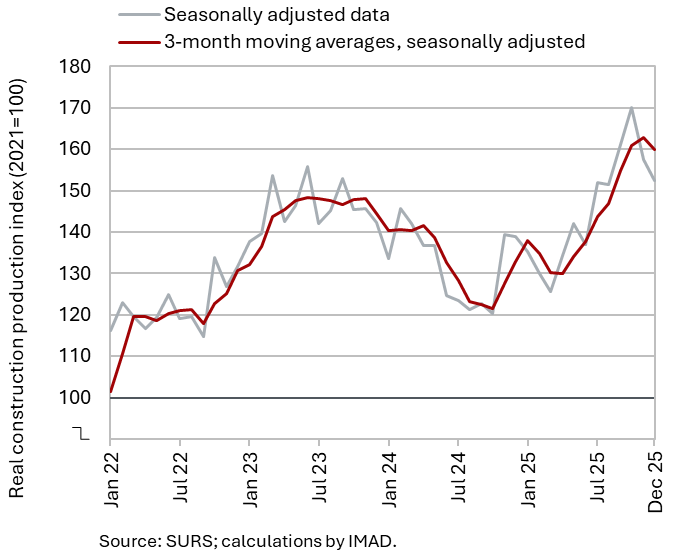
In December 2025, the value of construction work put in place declined slightly (seasonally adjusted), but remained significantly higher year-on-year. Following a decline in the first quarter, construction activity strengthened over the rest of the year, amid monthly fluctuations (seasonally adjusted). In December, it edged downwards (by 3%, seasonally adjusted), but was still considerably higher than a year earlier (10%). In 2025 as a whole, the value of construction put in place increased by 10% relative to 2024. The largest increases were recorded in specialised construction activities (15%) and in the construction of non-residential buildings (13%). Civil engineering activity also expanded (7%), while growth in the construction of residential buildings was more modest (2%).
Some other data, however, point to much lower growth in construction activity. According to VAT data, activity in construction companies in 2025 was 5% higher than in 2024, which is half the growth rate implied by data on the value of construction put in place. Similarly, data on the value of production in the manufacture of non-metallic mineral products, which is traditionally strongly linked to construction, do not indicate such high growth: production increased by only 1%.
Current account of the balance of payments, December 2025
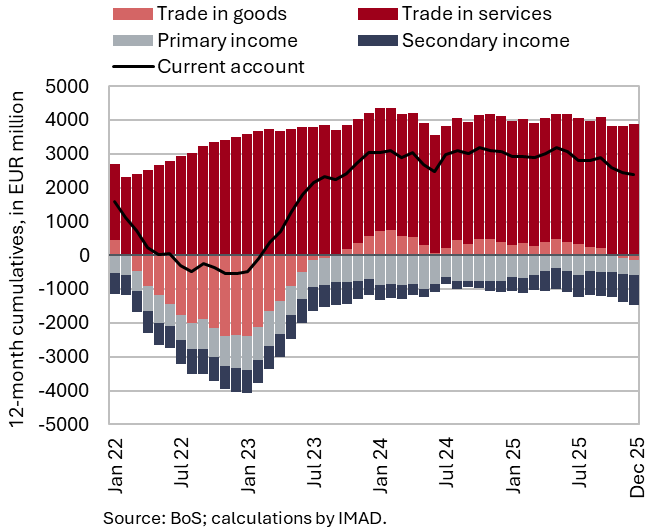
The current account surplus, which had remained relatively elevated in 2023–2024 (4.7% of GDP), declined somewhat last year (3.4% of GDP). The narrowing of the surplus was primarily attributable to a widening secondary income deficit, driven by higher net private sector transfers to the rest of the world and lower inflows of funds to the general government from abroad. Higher net receipts of non-life insurance premiums (related to motor insurance exports) exceeded the growth in premium payments (associated with higher imports of reinsurance). However, personal transfers by resident households to the rest of the world rose markedly. The general government sector received significantly lower inflows from the EU budget.
The goods balance also contributed to the narrowing of the current account surplus, shifting from a surplus in 2024 to a deficit in 2025 (the surplus in trade with non-EU countries was smaller, while the deficit in trade with EU Member States widened). The services surplus increased, most notably in insurance services, reflecting the expansion of a Slovenian insurance company’s operations in the Italian motor insurance market. The surplus in transport services and in research and development services also widened. The primary income deficit narrowed, mainly due to smaller net outflows from equity income (dividends and profits) and higher compensation of employees earned by Slovenian residents working abroad.
Electricity consumption by consumption groups, January 2026
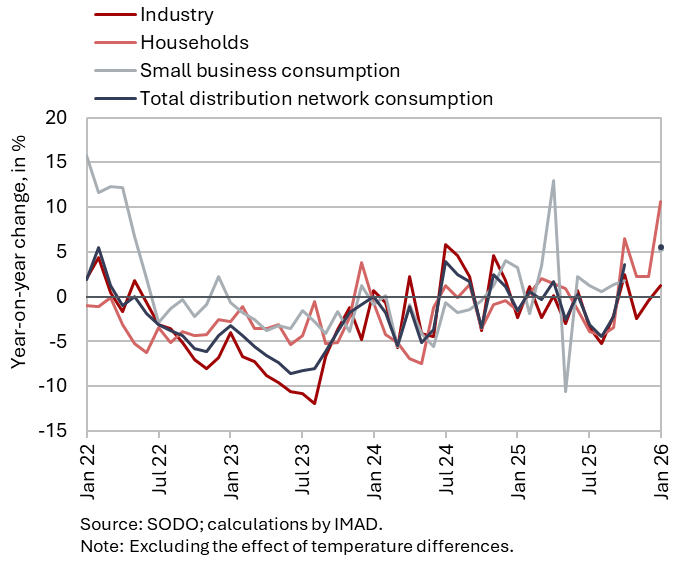
Electricity consumption in the distribution network was 5.6% higher year-on-year in January. Industrial consumption increased by 1.2% year-on-year, despite one fewer working day this year, with the actual calendar effect likely limited due to the distribution of public holidays. Small business consumption rose by 5.3% year-on-year. Year-on-year growth in household electricity consumption remained high even after excluding the weather effect (10.6%). This may indicate broader changes in household heating patterns, in particular greater use of electrical appliances (e.g. heat pumps).