
Charts of the Week
Charts of the week from from 9 to 13 November 2026: manufacturing production, activity in construction, current account of the balance of payments and electricity consumption by consumption group
Growth in manufacturing output slowed in the third quarter, while construction activity stagnated after accelerating at the beginning of the year. In both sectors, activity remained higher year-on-year. The current account surplus was slightly lower year-on-year in the third quarter, mainly reflecting lower receipts from the EU budget and higher contributions to it.
Manufacturing production, September 2026
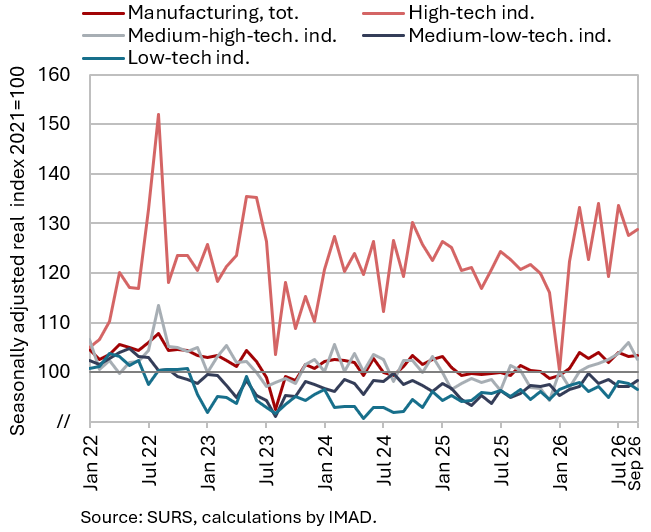
Growth in manufacturing production slowed in the third quarter (seasonally adjusted); production was 3.3% higher than in the same period last year. Quarter-on-quarter growth was driven mainly by medium-high- and high-technology industries (seasonally adjusted), where production was around 6% higher on average than a year earlier. Growth in medium-low- and low-technology industries remained modest, as in the first half of the year (seasonally adjusted), while year-on-year growth also remained broadly unchanged (at around 2.2%).
In the first nine months of the year, manufacturing output was 2.3% higher year-on-year. Production increased strongly in the manufacture of ICT equipment, motor vehicles (supported by the start of production of electric passenger cars), and other machinery and equipment. Some less technologically intensive industries also made significant contributions to overall growth, particularly the manufacture of fabricated metal products, the manufacture of food products, and the repair and installation of machinery and equipment.
The outlook for manufacturing has generally been improving since reaching its lowest level of the year in April. The proportion of companies expecting increases in production and employment is rising, although shortages of skilled labour remain a significant limiting factor. The indicator of total orders also continues to improve. Insufficient demand remains a significant limiting factor, although its impact is smaller than last year.
Activity in construction, September 2026
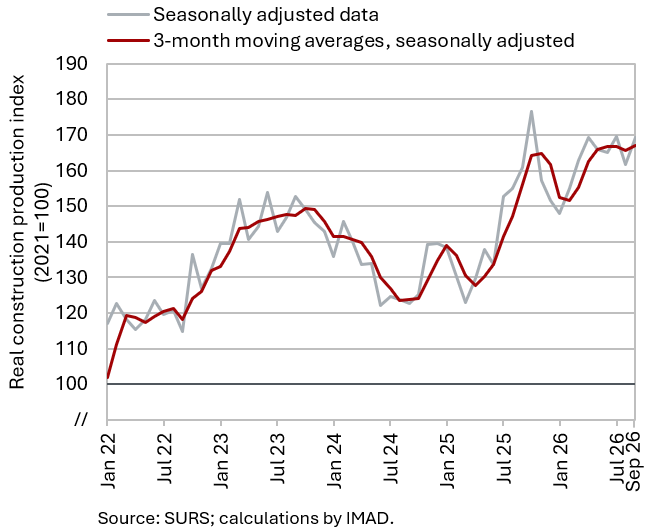
The value of construction work increased in September and was 7% higher year-on-year in the third quarter. Following strong growth at the beginning of the year, the value of construction work remained broadly unchanged in the third quarter. However, due to the strong acceleration in construction activity in the second half of last year, year-on-year growth in construction activity in the third quarter (7%) was considerably lower than in the previous four quarters, when it averaged as much as 23%.
Construction prices have increased considerably year-on-year this year. The implicit deflator of the value of construction work (which measures construction prices) reached 5.4% in the third quarter. The year-on-year growth rate of the value added deflator in construction rose to 7.9% in the third quarter. This suggests that prices of construction services are rising faster than input costs, or that profit margins in construction are increasing amid strong demand.
Current account of the balance of payments, September 2026
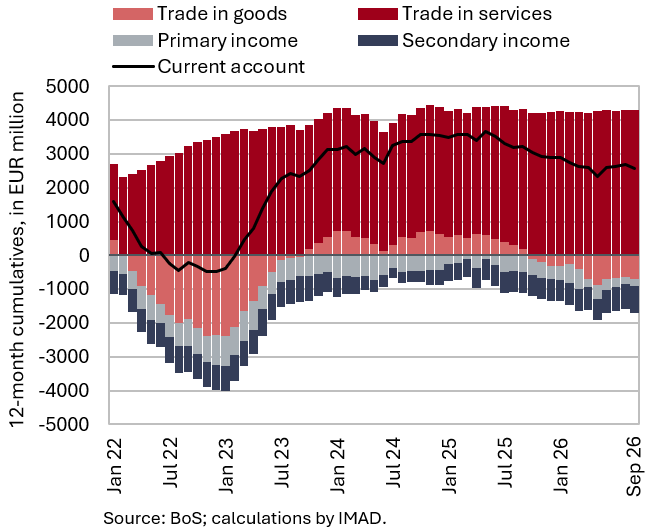
The current account surplus (EUR 943 million) was slightly lower in the third quarter than in the same period last year (EUR 970 million). This was mainly due to a EUR 106 million increase in the secondary income deficit, largely reflecting lower general government receipts from the EU budget and higher contributions to the EU budget based on gross national income and value added tax. Trade in goods and services also contributed to the decline in the current account surplus, albeit to a lesser extent. The goods surplus declined by EUR 12 million. We estimate that the positive volume effect (EUR 233 million) roughly offset the negative external price effect (EUR 245 million) resulting from a deterioration in the terms of trade (by 2.3%). The services surplus was EUR 18 million lower year-on-year, mainly due to smaller surpluses in trade in insurance services, construction services and manufacturing services on physical inputs owned by others. The primary income deficit narrowed due to lower net outflows of income from equity capital (dividends and profits).
Electricity consumption by consumption group, October 2026
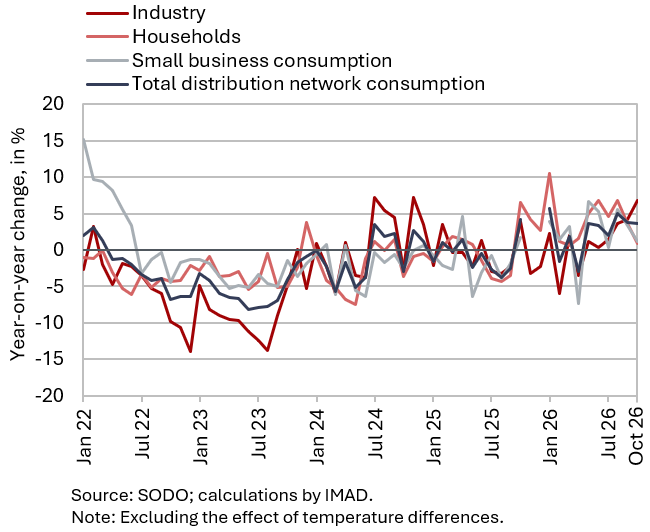
Electricity consumption in the distribution network was 3.6% higher year-on-year in October. Industrial electricity consumption and consumption by other business entities, which may indicate developments in economic activity, were 6.8% and 1.2% higher year-on-year, respectively. Household electricity consumption was just under 1% higher.