Slovenian Economic Mirror
Slovenian Economic Mirror 1/2026
Manufacturing output and exports, which recorded a slight month-on-month increase in November, were lower year-on-year over the first eleven months of the year. The largest declines were recorded in the manufacture of motor vehicles, trailers, semi-trailers and other transport equipment and in the metal industry, which also saw a decline in exports; exports of other machinery and equipment and of certain other materials also declined markedly. The export market share in the EU market also decreased year-on-year in the first three quarters, largely due to declines across most major manufacturing product groups. By contrast, growth in the value of construction work put in place strengthened markedly from the second quarter of last year onwards and, over the first eleven months, was around one tenth higher year-on-year. Household consumption continued to increase in the fourth quarter, with purchases of new passenger cars recording the strongest growth. Real turnover was higher year-on-year in all trade sectors over the first ten months. In other market services, real turnover declined sharply in October after strong growth in the third quarter, while over the first ten months of 2025 it was lower on a year-on-year basis only in administrative and support service activities. The economic sentiment indicator, which strengthened further in December, once again exceeded its long-term average, for the first time in three years. The number of persons in employment was slightly lower year-on-year over the first eleven months, while the number of unemployed persons in December slightly exceeded the very low level recorded a year earlier. With slower growth in the public sector, nominal gross wage growth further eased somewhat in October. Consumer prices remained unchanged in December for the third consecutive month, while year-on-year growth increased. The selected topic focuses on life satisfaction in Slovenia, which reached its highest level on record in the autumn of last year.
Economic sentiment (ESI) in the euro area, December 2025
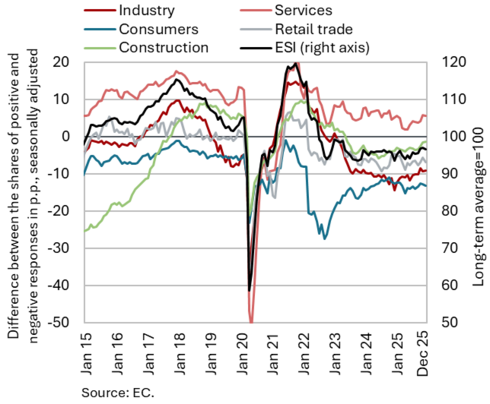
Euro area economic sentiment indicators for the fourth quarter of 2025 point to a continued expansion of economic activity. In the fourth quarter of 2025, the average value of the composite Purchasing Managers’ Index (PMI) for the euro area reached its highest level (52.3) since the second quarter of 2023. The services PMI strengthened further, rising above its long-term average, while the manufacturing PMI signalled a moderation in activity growth. The Economic Sentiment Indicator (ESI) for the euro area also increased to its highest level since the second quarter of 2023, with confidence improving quarter-on-quarter across all sectors and among consumers. Economic sentiment was also more favourable than in the fourth quarter of 2024, with confidence rising markedly in both industry and construction. Nevertheless, overall sentiment has remained below its long-term average since June 2022. In Germany, Slovenian largest trading partner, confidence indicators present a mixed picture. The Ifo Business Climate Index deteriorated slightly further in December, reflecting more pessimistic expectations regarding business conditions in manufacturing. By contrast, the ZEW indicator increased in December, supported by a pronounced improvement in expectations within the automotive industry.
ECB euro area GDP growth forecasts, December 2025
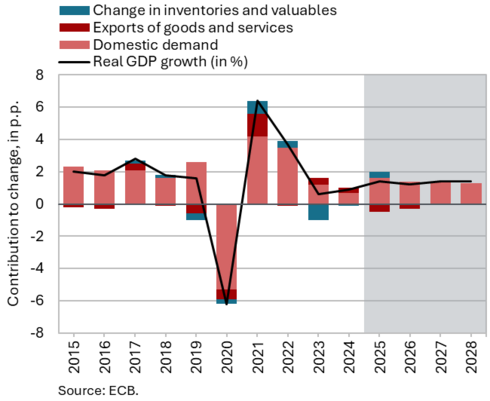
In its December outlook, the ECB expects euro area GDP growth to moderate in 2026 relative to 2025. Despite a challenging international environment, the euro area economy expanded more strongly last year than expected by international institutions, primarily reflecting the effects of frontloading in anticipation of higher trade tariffs. This year, private consumption is expected to remain the main driver of growth, bolstered by rising real wages, high employment and a gradual decline in the saving rate. Economic activity will also be supported by business investment and higher expenditure on infrastructure and defence (particularly in Germany). Real GDP growth is projected at 1.2% this year (1.4% in 2025) and at 1.4% in both 2027 and 2028. Risks to the realisation of these projections remain elevated. Despite some easing of trade tensions, the international environment remains uncertain, which could negatively affect supply chains, exports, as well as consumption and investment. The ECB also highlighted the deterioration in conditions on global financial markets and ongoing geopolitical tensions as significant downside risks. On the upside, economic growth could be stronger than expected due to higher defence and infrastructure spending and reforms aimed at enhancing productivity.
Commodity prices, December 2025
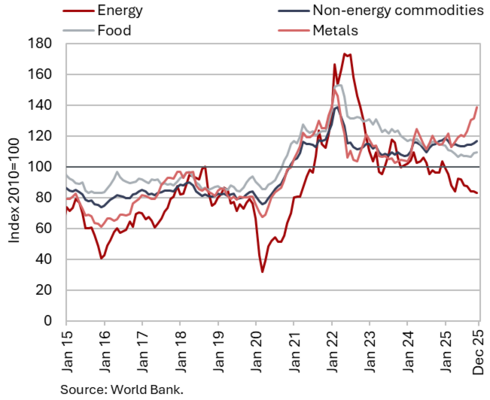
The average Brent crude oil price declined in December compared with November, while the average price of non-energy commodities increased slightly. The average dollar price of Brent crude oil fell by a further 1.9% to USD 62.60 and the euro price by 3.2% to EUR 53.45. Year-on-year, oil prices were 15.3% lower in US dollars and 24.2% lower in euros. On average in 2025, the oil prices were 14.2% lower in US dollars and 17.4% lower in euros than a year earlier. In December, the average euro price of natural gas on the European market (Dutch TTF) declined further, amid increased inflows of liquefied natural gas from the United States and stable supply from Norway. The price fell by 10.5% to EUR 27.62/MWh, marking the lowest level in nearly two years. On a year-on-year basis, the price decreased by 38.8%. On average in 2025, it was 5.3% higher than in 2024. According to the World Bank, the average dollar price of non-energy commodities increased slightly month-on-month in December, while remaining broadly unchanged year-on-year. Month-on-month, prices of metals and minerals recorded the largest increase (5.3%) and were also significantly higher year-on-year (19.2%). In 2025, dollar prices of non-energy commodities were 2.4% higher than in 2024.
Effective exchange rate, Q3 (REER ulc) and Q4 2025 (REER hicp, ppi)
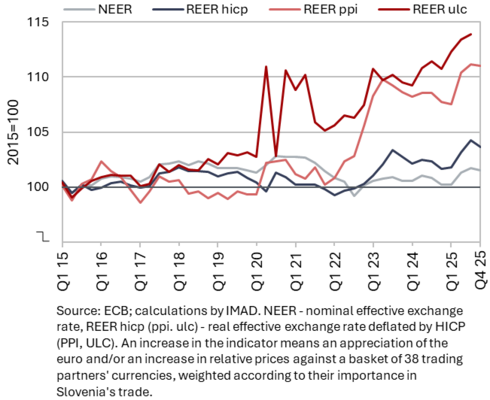
An already ongoing weakening of cost competitiveness was compounded in mid-2025 by a deterioration in price competitiveness indicators, which came to a halt towards the end of the year. Cost competitiveness (REER ulc) had been gradually deteriorating throughout most of 2024, mainly due to strong growth in (nominal) unit labour costs (NULC) in the construction sector. In the first three quarters of 2025, however, NULC growth across business sector activities was most pronounced in manufacturing and market services. Compared with the EU, Slovenia recorded particularly strong NULC growth in manufacturing, although it remained lower than in the Visegrad countries. Price competitiveness indicators (REER ppi, hicp), which had been gradually improving following the energy crisis, deteriorated in the second and third quarters of 2025, while their growth came to a halt in the fourth quarter. In addition to the depreciation of the euro (a decline in the NEER), developments were also influenced by lower growth in consumer prices (HICP) in Slovenia compared with its trading partners (while PPI growth was similar).
Short-term indicators of economic activity in Slovenia, October−November 2025
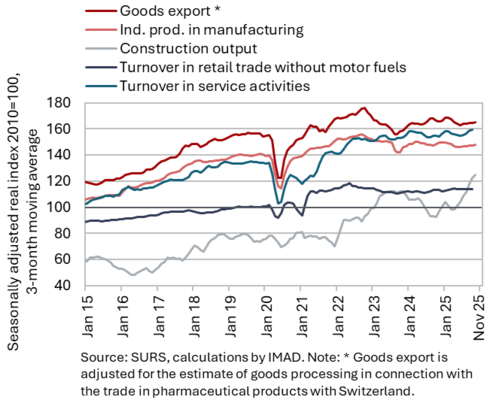
Slovenian goods exports in the first eleven months of 2025 were slightly lower than a year earlier, while activity in construction and household consumption increased over the first ten months. Real goods exports increased month-on-month in November for the second consecutive month, while imports declined. In the first eleven months of 2025, goods exports were 0.2% lower than in the same period of 2024, while imports were 1.6% higher. The decline in exports was mainly driven by lower exports of vehicles and other machinery and equipment, as well as iron and steel and some other materials (rubber products, mineral products, paper). Manufacturing output increased slightly month-on-month in November. Over the first eleven months, it remained lower year-on-year; among major activities, the year-on-year decline was largest in the manufacture of motor vehicles, trailers, semi-trailers and other transport equipment and in the metal industry. Following a decline in the first quarter of 2025, growth in the value of construction put in place strengthened markedly from the second quarter onwards; over the first ten months it was one tenth higher year-on-year. Real turnover in most trade segments increased in October following a decline in the third quarter; over first ten months of 2025, sales in all trade segments increased year-on-year. Real turnover in market services declined sharply in October after strong growth in the third quarter; in the first ten months of 2025, it was lower year-on-year only in administrative and support service activities.
Trade in goods – in real terms, November 2025
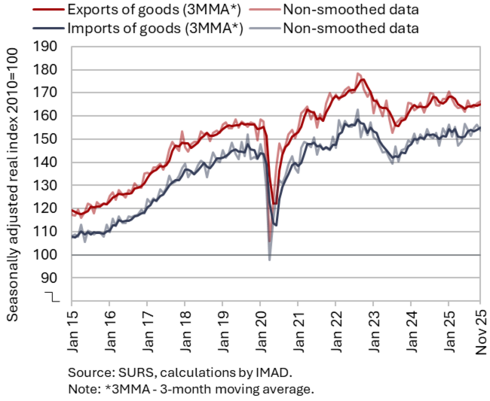
Real goods exports increased month-on-month in November, while imports declined; on average over the last two months, both were higher than in the third quarter (seasonally adjusted). Real exports of goods increased for the second consecutive month, with the largest contribution coming from exports of road vehicles and equipment, which are otherwise subject to considerable volatility. Exports of other machinery and equipment and of chemical products, in particular pharmaceuticals, also increased. By contrast, exports of primary products declined, especially food, as well as exports of certain materials. After several months of growth, real imports of goods declined in November. The decrease was driven primarily by lower imports of intermediate goods, which have exhibited pronounced volatility for several months (seasonally adjusted). In the first 11 months of 2025, exports fell by 0.2% year-on-year and imports increased by 1.6%. The year-on-year decline in exports was mainly due to lower exports of vehicles and other machinery and equipment; exports of iron and steel and of certain other materials (rubber products, mineral products, paper) were also lower. Exports of most other main product groups increased, most notably pharmaceuticals. Export orders in manufacturing remained unchanged at a very low level in December.
Slovenia’s export market share in the EU market, Q3 2025
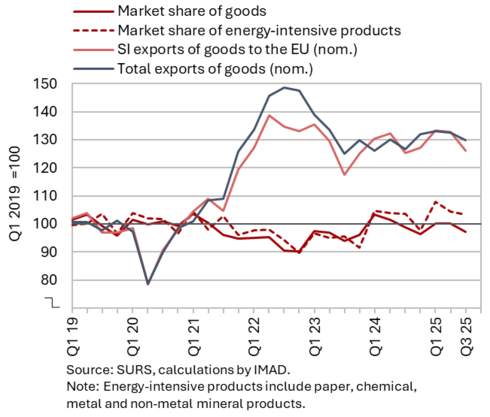
Slovenia’s export market share in the EU market declined year-on-year in the third quarter of 2025. The year-on-year growth in the nominal euro value of Slovenian goods exports lagged behind the growth of EU goods imports in all of the first three quarters of 2025. As a result, Slovenia’s export market share in the EU market was 1.8% lower year-on-year in the third quarter, and 2.1% lower cumulatively over the first three quarters. The year-on-year decline was driven by most main manufacturing product groups (road vehicles, electrical machinery and equipment, industrial machinery, and pharmaceutical products), while the market share of energy-intensive products remained similar to that a year earlier. Among Slovenia’s main trading partners, the market share in the first three quarters of 2025 was lower than a year earlier in Germany, Italy, France and Croatia, while it was higher only in Austria. The year-on-year decline was driven primarily by lower competitiveness in the EU market (e.g. cost pressures; see also Figure 4, the decline in passenger car exports following the discontinuation of a vehicle model at Slovenia’s largest car manufacturer), as Slovenia’s export structure to the EU remained broadly aligned with the structure of EU demand.
Trade in services – in real terms, November 2025
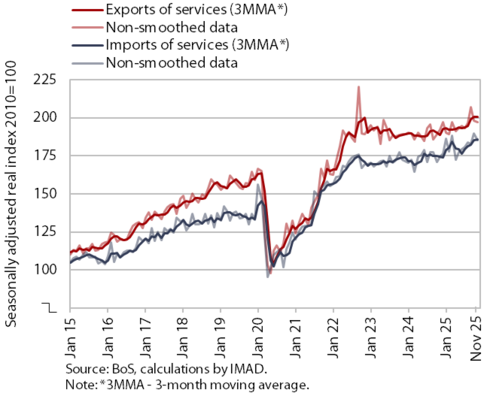
Exports and imports of services declined month-on-month in November; both were higher year-on-year. Following strong growth in September, real exports of services declined for the second consecutive month (– 0.6%), but remained higher year-on-year. The monthly decline was driven mainly by a pronounced monthly drop in exports of construction services, while exports of tourism-related services also decreased slightly for the second month in a row. Exports of transport services (excluding electricity transmission) remained unchanged compared with the previous month, while exports of other business services and ICT services increased again. In October and November, exports of services declined particularly to Austria and Germany, and in November also to Italy and Switzerland. In addition to transport services, the monthly decline in services imports (– 2.4%) was driven particularly by some smaller categories of other services, which had otherwise recorded strong upward fluctuations in October (personal, cultural and recreational services and government-related services) (all seasonally adjusted).
In the first eleven months of 2025, exports and imports of services were higher than in the same period of 2024 (by 3.2% and 5.2%, respectively), which also applies to most main service categories, except transport and construction services. The year-on-year increase in exports was driven primarily by exports to Italy (insurance services up by EUR 323 million year-on-year), with a notable contribution also from Switzerland (other business and ICT services) and France (transport services).
Production volume in manufacturing, November 2025
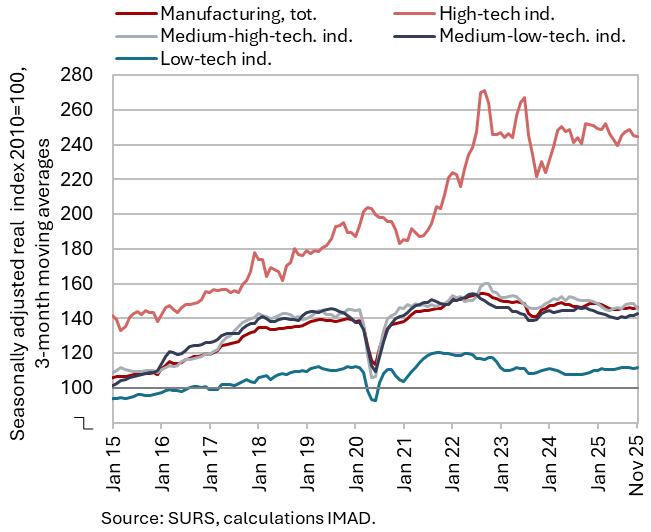
Manufacturing production strengthened somewhat month-on-month in November, while over the first eleven months of 2025 it remained lower year-on-year. After contracting at the beginning of 2025, it remained largely unchanged. On average in October and November, it stood at the level of the third quarter; only output in medium-low-technology industries was slightly higher (owing to a weak August). In the remaining three groups of industries, output declined slightly after increasing in the third quarter (all seasonally adjusted). In the first eleven months, total output was 1.1% lower year-on-year (working-day adjusted), while only output in low-technology industries increased (by 2.5%, working-day adjusted). Compared with the same period of 2024, the largest increases were recorded in other manufacturing, food production and the wood industry. Output in the leather industry was one quarter lower. In other groups of industries by technological intensity, output in most industries was lower year-on-year in the first eleven months (with the exception of the manufacture of ICT equipment and the repair and installation of machinery and equipment). The sharpest decline was recorded in the manufacture of motor vehicles, trailers, semi-trailers and other transport equipment (by around 9%), while output in the metal industry was lower by around 5%.
Activity in construction, November 2025
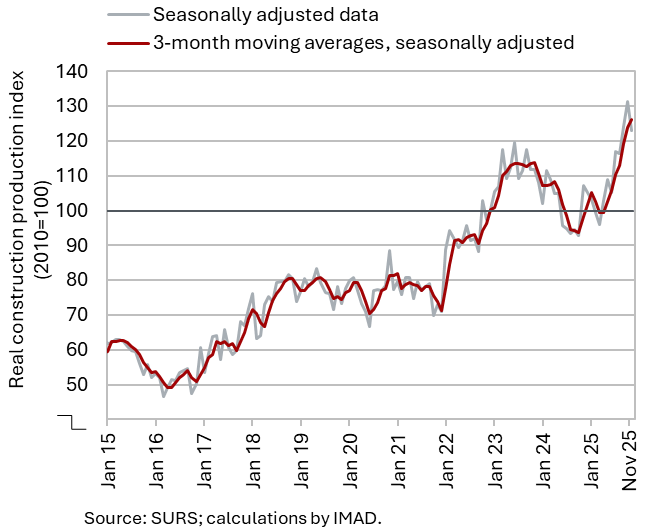
The value of construction put in place declined slightly in November, while remaining significantly higher year-on-year. Following a decline in the first quarter, construction activity strengthened over the remainder of the year, amid monthly fluctuations. In November, it decreased by 6% (seasonally adjusted), but was still significantly higher (by 12%) than a year earlier. Overall, the value of construction put in place in the first eleven months of last year was 10% higher than in the same period a year earlier. The largest increase was recorded in the construction of non-residential buildings and in specialised construction activities (15% in both), activity in civil engineering also rose (7%), while construction of residential buildings remained broadly unchanged (1%).
The construction confidence indicator reached a year-and-a-half high in November, before edging down slightly in December. Companies generally assess new orders as normal. The main constraint remains the shortage of skilled labour. Only about one tenth of companies cite insufficient demand as a limiting factor, indicating that the construction sector is currently not facing significant demand-side pressures but is instead constrained by supply-side factors.
Turnover in trade, October 2025
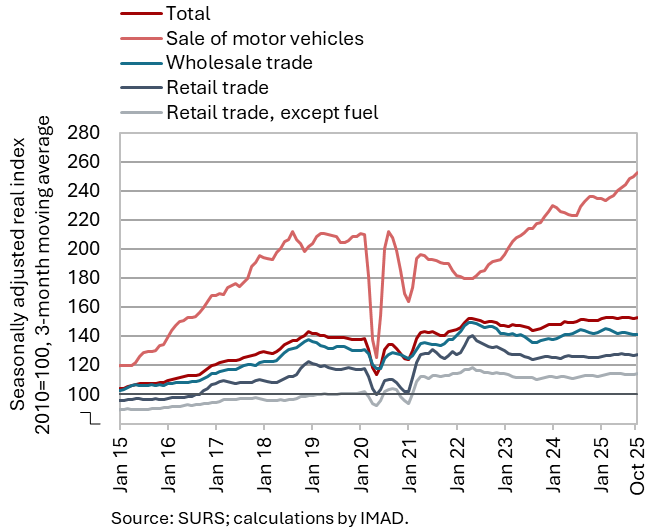
Turnover in most trade segments increased in October (seasonally adjusted) following a decline in the third quarter. In retail trade in food and non-food products, turnover increased markedly in October after a decline or stagnation in the third quarter. Relatively strong growth also continued in the sale of motor vehicles. By contrast, turnover in wholesale trade declined further in October and was the only trade sector to record a year-on-year decrease. Over the first ten months of the year, sales increased year-on-year in all trade sectors. Growth in the sales of motor vehicles was robust (7%), while in other trade sectors it was modest (averaging around 1%).
Turnover in market services, October 2025
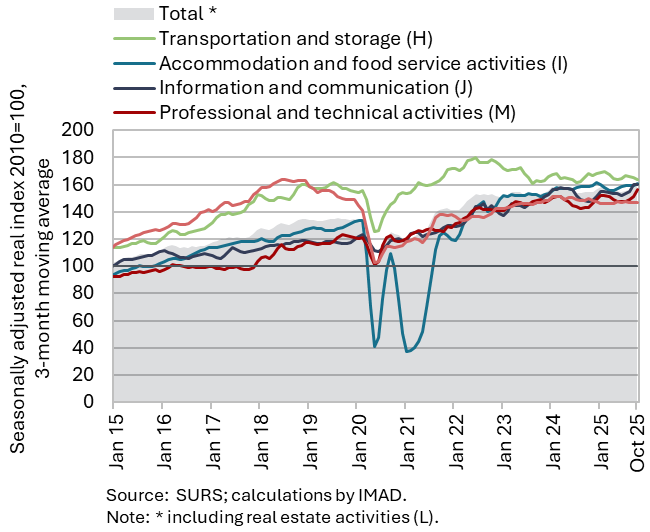
After strong growth in the third quarter, total real turnover in market services declined markedly in October (by 3.4%, seasonally adjusted), while it remained higher year-on-year (by 3.1%). On a month-on-month basis, the sharpest decline in turnover was recorded in information and communication (after a significant increase in the third quarter), primarily due to a contraction in sales of computer services (on domestic and foreign markets). After modest growth in the third quarter, turnover in transportation and storage declined markedly in October, with declines recorded in both main segments – land transport and warehousing. After a prolonged period of stagnation, turnover also decreased slightly in administrative and support service activities. By contrast, relatively strong growth in turnover continued for the third consecutive month in professional and technical activities, driven mainly by architectural and engineering services. Turnover in accommodation and food service activities also increased for the third consecutive month. In the first ten months of 2025, administrative and support service activities was the only activity with a year-on-year decrease in real turnover.
Selected indicators of household consumption, Q4 2025
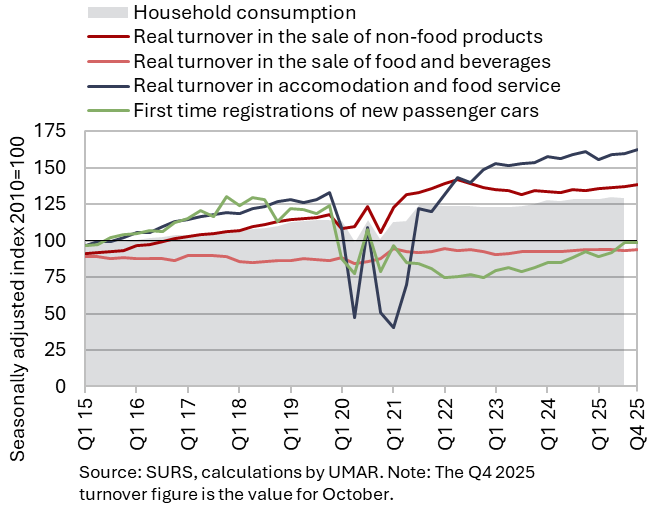
Following real growth of 1% in the third quarter, the available data also suggest that household consumption increased year-on-year in the fourth quarter of 2025. The number of sold new passenger cars used by natural persons was 6% higher year-on-year in October. Households also recorded higher year-on-year spending on food, beverages and tobacco products as well as on non-food products (total turnover in retail sale of food products and non-food products was 3% higher in real terms). The number of overnight stays by domestic tourists in Slovenia and Croatia and total spending on tourism services abroad were also higher year-on-year.
Year-on-year growth in household consumption is also indicated by the increase in the nominal value of fiscally verified invoices (used as a proxy for final sales of services and goods), which in the fourth quarter of 2025 was similar to that in the third quarter (around 3%).
Electricity consumption by consumption group, December 2025

The December data indicate a year-on-year decrease in industrial electricity consumption. Despite one working day more in December 2025, electricity consumption was 0.4% lower than in December 2024. By contrast, household electricity consumption increased by 2.2% year-on-year.
Real estate, Q3 2025
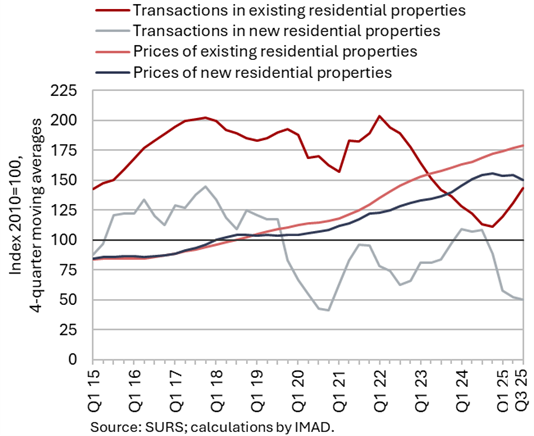
The year-on-year growth in dwelling prices halved to 2.7% in the third quarter of 2025. This slowdown was primarily driven by a year-on-year decline in the prices of newly built dwellings (-9.5%), while year-on-year growth in the prices of existing dwellings remained broadly unchanged from the first two quarters (5.2%). Following a pronounced decline over the period 2022–2024, the number of transactions of existing dwellings was more than half higher year-on-year. Sales of newly built dwellings were lower year-on-year (by 12.4%), although they accounted for only a small share of total sales (5%). After a pronounced increase in the previous quarter, their prices declined significantly in the third quarter and were similar to those recorded two years earlier.
Road and rail freight transport, Q3 2025
The volume of road and rail freight transport, which had been declining from 2022, increased slightly in the third quarter of 2025. Overall, the volume of road transport increased by 5% on a quarterly basis (seasonally adjusted), but continued to decline year-on-year (by 3%). In road transport performed by Slovenian vehicles, the volume of cross-trade increased markedly for the second consecutive quarter (following a sharp decline in the first quarter), while the volume of transport at least partly taking place on Slovenian territory (exports, imports and national transport) increased only modestly. The share of cross-trade in total transport was 43%, which was 5 p.p. lower than before the COVID-19 pandemic. Rail freight transport on Slovenian territory increased by 3% in the third quarter (seasonally adjusted), but decreased by 4% year-on-year. In 2025, the volume of road and rail freight transport was the lowest since 2016.
Economic sentiment, December 2025
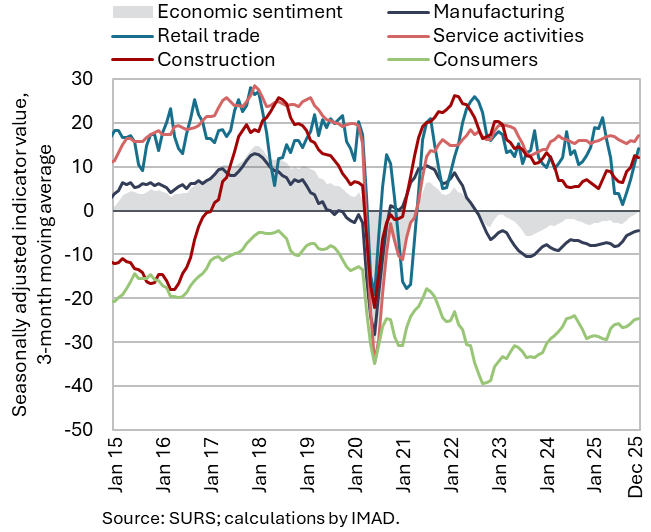
The economic sentiment indicator improved for the sixth consecutive month in December and was also higher year-on-year. On a monthly basis, confidence indicators increased in services, retail trade and manufacturing. Confidence indicators deteriorated among consumers and in construction, where the decline was driven by the indicators for total order books and employment expectations. In year-on-year terms, all confidence indicators were noticeably higher, except in retail trade, where it stagnated. The sentiment indicator has remained above its long-term average for the fourth consecutive month. Among activities, confidence indicators in construction, services and retail trade exceed their long-term averages.
Households facing financial distress, December 2025
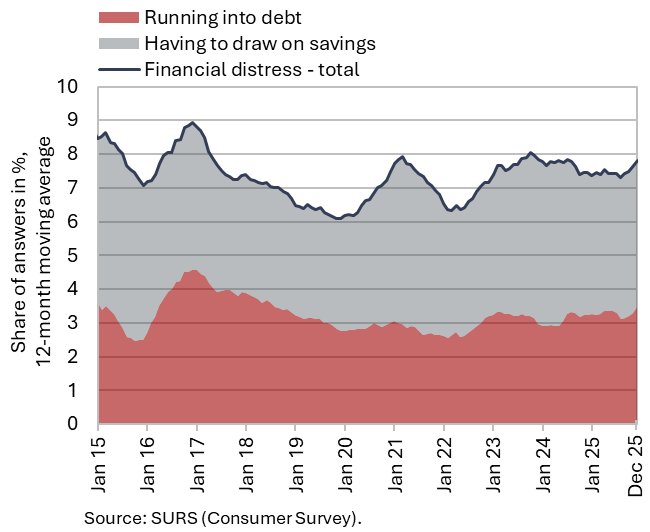
In the fourth quarter of 2025, the situation of households facing financial distress deteriorated both quarter-on-quarter and year-on-year, with a marginal improvement observed only among households in the lowest income quartile. The share of households from the first income quartile facing financial distress decreased by 0.3 p.p. quarter-on-quarter and by 0.7 p.p. year-on-year, reaching 13.2%. By contrast, the financial situation of households in the second and third income quartiles deteriorated. The share of households facing financial distress in these groups increased by 2.6 p.p. year-on-year, reaching 10.5% and 8.0%, respectively. Among households facing financial distress, the proportion of those running into debt was slightly higher year-on-year, while the share of those having to draw on savings to meet their needs remained broadly unchanged.
Number of persons in employment, November 2025
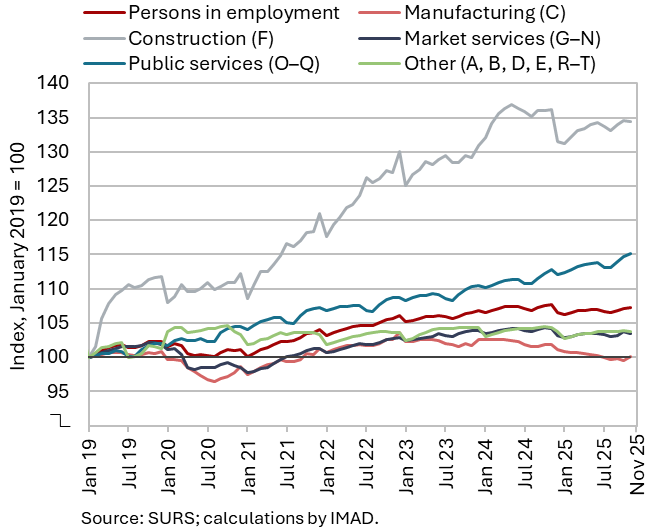
The number of persons in employment remained similar in November to previous months (seasonally adjusted) and was 0.4% lower year-on-year. The number of employees declined year-on-year (–0.6%), while the number of self-employed increased (1.3%). The sharpest year-on-year decline in the number of persons in employment was recorded in administrative and support service activities (– 2.1%), mainly due to a decrease in employment agencies, followed by manufacturing (–1.8%), and information and communication (–1.3%). The number of persons in employment continued to increase on a year-on-year basis in public service activities, particularly in human health and social work activities (up 3.4%). The number of foreign citizens in employment increased by 1.5% year-on-year in November, while the number of Slovenian nationals in employment declined by 0.7%.
In the first eleven months of 2025, the number of employed persons remained 0.4% lower year-on-year. The structure of the decline by activity was similar to that in November.
Number of registered unemployed, December 2025
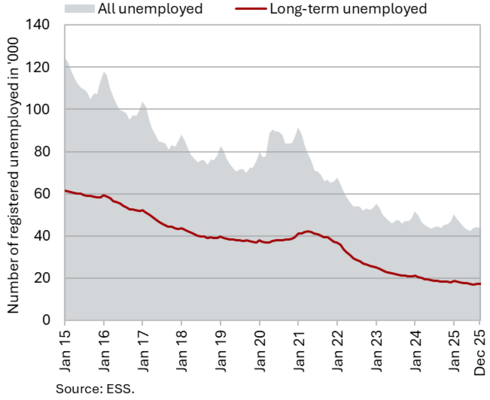
In December 2025, the number of unemployed persons (seasonally adjusted) remained broadly unchanged on a month-on-month basis (-0.1%). According to original data, 47,177 people were unemployed at the end of December, representing a 3% increase compared with the end of November. This increase largely reflects seasonal factors, notably a higher inflow into unemployment following the expiry of fixed-term employment contracts. On a year-on-year basis, unemployment increased slightly (by 0.3%). The year-on-year declines in long-term unemployment (–5.6%) and in unemployment among persons aged 50 and over (– 5.3%) were somewhat smaller than in previous months. The number of unemployed young persons (15–29 years) has been higher year-on-year since the end of 2024 (in December, there were 10,944 unemployed young people, representing a 9.4% year-on-year increase).
In 2025, on average 45,410 persons were registered as unemployed, 1.2% fewer than a year earlier.
Average real gross wage per employee, October 2025
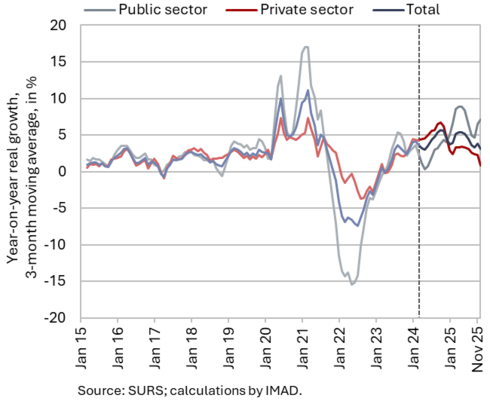
Year-on-year nominal growth in the average gross wage was higher in October (7.7%) than in the preceding months, primarily due to stronger growth in the public sector. In the latter, the nominal wage was 12.1% higher year-on-year in October. The strengthening compared with the preceding months was due to the payment of the second instalment of the agreed increase in base wages. Growth in the private sector also remains relatively strong (5.2 %) amid still considerable labour shortages.
In the first ten months of 2025, the overall average gross wage increased by 4.6% in real terms (by 7% in nominal terms) – by 7.4% in the public sector and by 2.9% in the private sector (by 9.8% and 5.3% in nominal terms respectively).
Number of FSA beneficiaries and UB recipients, November 2025
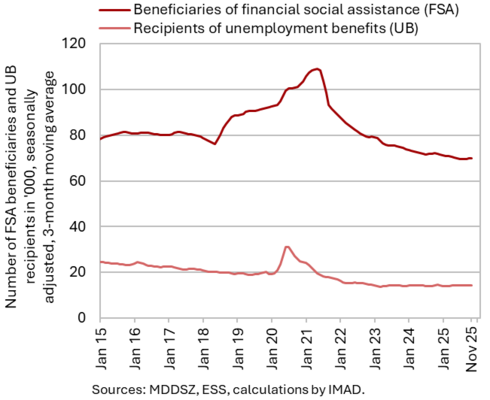
The number of unemployment benefit (UB) recipients and the number of financial social assistance (FSA) beneficiaries declined again year-on-year in November. There were 13,493 UB recipients, representing a decrease of 3.7% compared with November 2024. In November, their share among all unemployed persons (29.5%) was slightly below the level recorded a year earlier (30.6%). With the continued decline in the number of long-term unemployed persons, who are often eligible for FSA, the number of FSA beneficiaries also fell year-on-year. In November, 68,493 persons were eligible for FSA, 2.5% fewer than a year earlier, representing a lower decline than in recent months. On average, around EUR 20 million per month was disbursed for FSA last year.
Consumer prices, December 2025
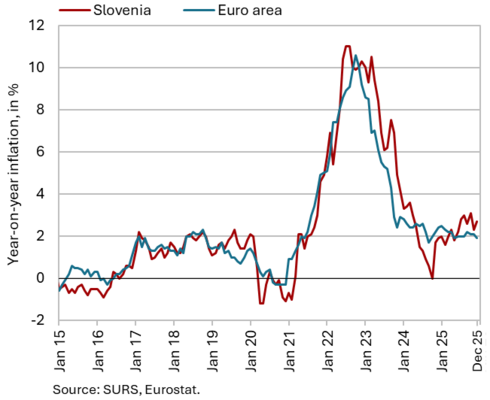
Consumer prices remained unchanged in December for the third consecutive month, while year-on-year growth increased by 0.4 p.p. to 2.7%. Less pronounced seasonal price reductions made a significant contribution to the increase in inflation. On a month-on-month basis, prices of package holidays and clothing and footwear declined
(by 3.1% and 0.8% respectively); however, in both categories the price decrease was roughly half as large as in December 2024. By contrast, insurance prices increased markedly on a monthly basis (by 4.5%). Food and non-alcoholic beverage prices, which were 4.5% higher year-on-year, continue to make the largest contribution to year-on-year inflation (0.8 p.p.), although their growth has been gradually easing in recent months. Prices in this group decreased by 0.9% between October and December of last year. Among the 12 CPI groups, the strongest year-on-year price growth in December was recorded in the health group (5.9%). Owing to its relatively low weight in the CPI basket (approximately 5%), this group contributed 0.3 p.p. to overall inflation. Against the backdrop of less pronounced seasonal price reductions for package holidays and higher insurance prices, year-on-year growth in service prices strengthened in December, rising by nearly one percentage point to 3.6%. Energy prices were 1.9% higher in 2025 than a year earlier, despite lower prices of petroleum products; the increase was driven primarily by electricity prices, which were 9% higher, and by prices of solid fuels, which were almost 15% higher.
Slovenian industrial producer prices, November 2025
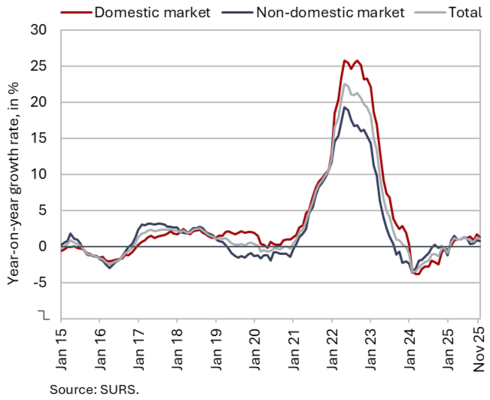
In November, the year-on-year growth in Slovenian industrial producer prices declined by 0.2 p.p., to 1.1%, amid a 0.3% month-on-month increase. The lower growth rate was primarily driven by a higher base effect in energy products, which had risen by more than one tenth in November last year. Energy prices were thus 7.3% lower year-on-year, and prices in the capital goods group were also slightly lower (by 0.1%). Prices of consumer goods continue to record the fastest growth (4.1%). This is driven mainly by the increase in prices of non-durable consumer goods (4.7%), where high year-on-year price growth in the manufacture of food products (5.5%) and beverages (5.6%) persists. Growth in raw material prices was 0.9% in November. Slovenian industrial producer prices were 1.3% higher year-on-year on the domestic market and 0.9% higher on foreign markets.
Loans to domestic non-banking sectors, November 2025
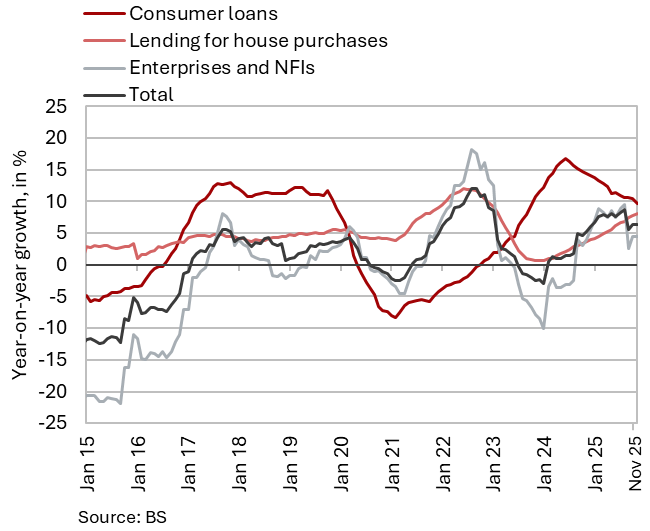
Year-on-year growth in the volume of loans to domestic non-banking sectors remained largely unchanged month-on-month (6.3%). Growth in corporate and NFI loans (4.5%) and household loans (7.6%) did not change significantly. Within household lending, housing loans grew by 8.1% and accounted for almost two-thirds of total household loans. The volume of new lending in the form of housing loans increased by half in the first eleven months of 2025 compared with the same period of 2024. The growth of consumer loans continued to moderate gradually and, at 9.6 %, was the lowest since October 2023. Year-on-year growth in non-financial sector deposits (6.3%) was maintained, driven primarily by an increase in overnight deposits (8.6%). These account for more than 80% of total non-banking sector deposits. Corporate and NFI deposits (7%) are increasing at a somewhat faster rate than household deposits (5.9%). The asset quality of the banking system remains good. In October, the share of non-performing exposures remained unchanged at 1.2%.
Government bond, Q4 2025
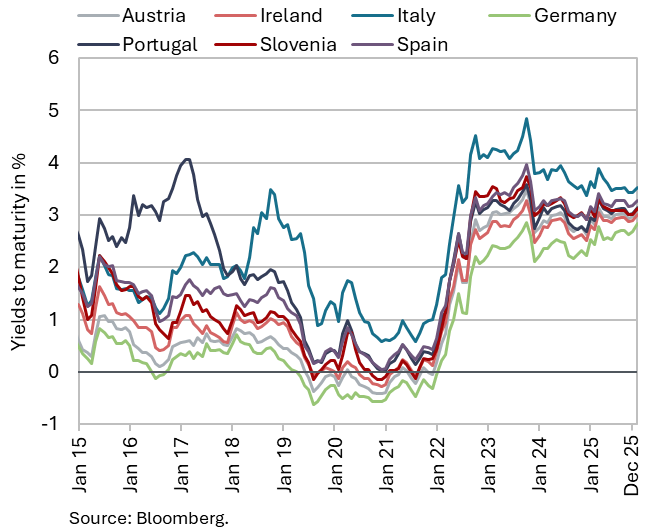
The yield to maturity on Slovenian government bonds declined by 4 basis points in the fourth quarter of 2025, to 3.05%. The spread to the German bond narrowed by 6 basis points (to 33 basis points), the lowest level since 2007. In the absence of inflationary pressures in the fourth quarter of last year, the ECB did not change its key interest rates.
Current account of the balance of payments, November 2025
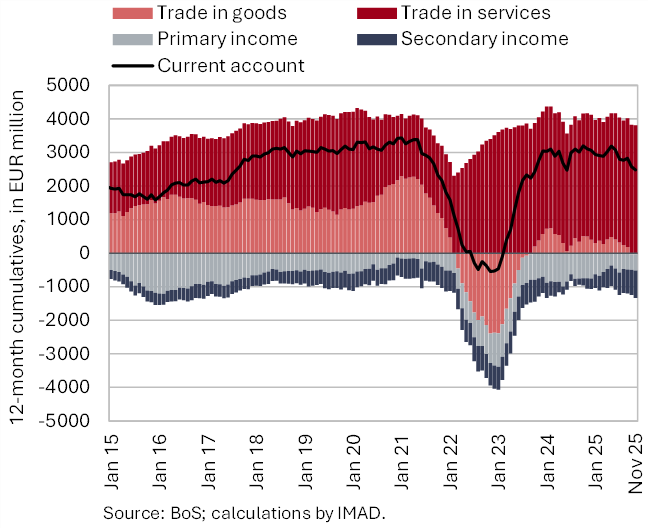
The current account surplus amounted to EUR 2.4 billion in the first 11 months of 2025 and was EUR 0.6 billion lower than in the same period of 2024. The decline was mainly driven by a wider secondary income deficit, primarily due to lower receipts from the EU budget. Amid faster growth in goods imports than exports, the goods balance also contributed to the reduction in the surplus. The services surplus, however, increased, most notably in travel services (growth in tourism receipts from foreign visitors exceeded the growth in expenditure by domestic residents on travel abroad). The surplus in insurance services also increased markedly, as a Slovenian insurance company expanded its business activities and related services in the Italian motor insurance market. The primary income deficit was lower, mainly due to smaller net outflows from equity income (dividends and profits) and higher earnings of Slovenian workers from employment abroad.
Revenue (top figure) and expenditure (bottom figure) of the consolidated general government budgetary accounts, November 2025
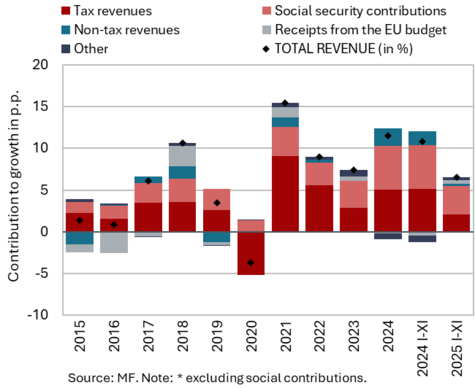
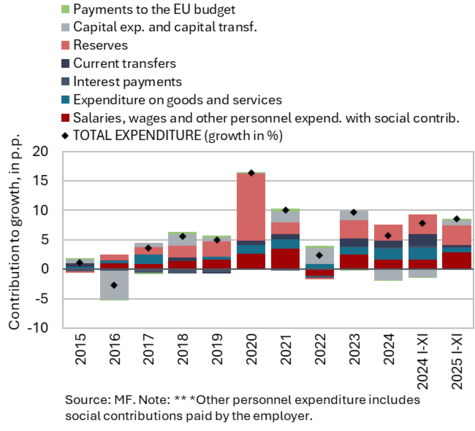
The deficit of the consolidated general government balance amounted to EUR 1.1 billion in the first eleven months of 2025, which is EUR 560 million more than in the same period a year earlier, with the increase being planned. Over the same period, general government revenues increased by 6.5%, significantly less than in the same period a year earlier (10.8%). This slowdown reflects cyclical factors and measures that temporarily boosted social-security contributions and certain tax revenues in 2024. Expenditure in the first eleven months of 2025 was 8.6% higher year-on-year, representing slightly higher growth than in the same period a year earlier (7.8%). The main drivers of expenditure growth in 2025 were employee compensation related to the implementation of the wage reform, pensions, and certain other transfers. After declining in 2024, capital expenditure also increased in 2025, particularly for the purchase of military equipment. The bulk of the consolidated general government deficit stemmed from the central government budget deficit. In the first eleven months of 2025, it amounted to EUR 976 million. As expected, it increased substantially in December and reached EUR 1,717 million in 2025 as a whole, or 2.4% of GDP, which is nevertheless slightly less than envisaged in the amended state budget for 2025 (EUR 1,866 million or 2.6% of GDP). The increase in the deficit at the end of the year was mainly driven by the payment of the winter allowance to public sector employees and pensioners, funds to cover the financial liabilities of public healthcare institutions, and an increase in investment expenditure.
EU budget receipts, December 2025
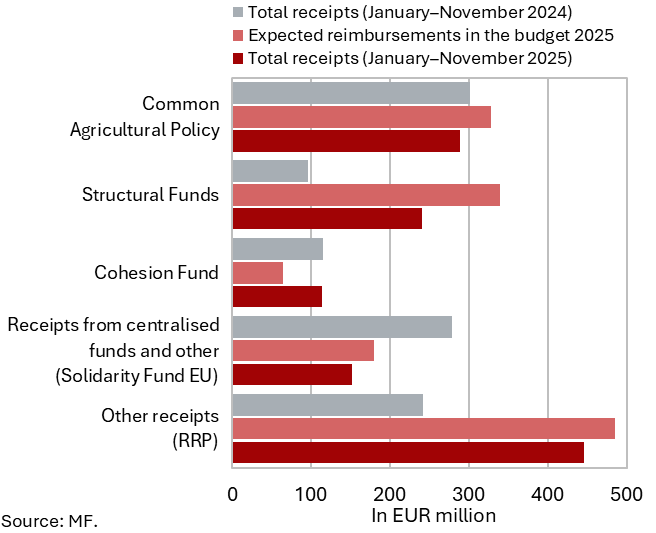
In 2025, Slovenia received more funds from EU sources than in 2024, and its positive net position also increased. Total receipts from the EU budget amounted to EUR 1,239.1 million, EUR 207 million more than a year earlier. At the same time, Slovenia paid EUR 719.8 million into the EU budget (EUR 635.8 million in 2024). As a result, the positive net budgetary position rose to EUR 519.3 million. The higher revenue recorded last year was related primarily to the implementation of the Recovery and Resilience Plan (EUR 444.8 million), with a high absorption rate relative to the amounts planned in the central government budget (91.8%), and to structural funds projects (EUR 240.4 million), where execution remained below plan (70.8%). Funds received from the Cohesion Fund (EUR 113.5 million) were broadly unchanged year-on-year and exceeded the planned inflows (174.6% of plan). In December 2025, Slovenia submitted its fifth payment request under the Recovery and Resilience Facility, with the maximum possible net payment amounting to around EUR 230.7 million. By the end of 2025, Slovenia had received EUR 1.54 billion under the Recovery and Resilience Plan, representing 72% of the total available funds.