Slovenian Economic Mirror
Slovenian Economic Mirror 2/2025
In Slovenia, short-term indicators suggest weak economic growth in the first two months of the year. On a year-on-year basis, exports, trade turnover, and construction activity increased, while turnover in market services and manufacturing output declined. In manufacturing, sentiment remains subdued due to uncertain economic conditions in the international environment. Economic sentiment continued to improve in March, with confidence indicators lower year-on-year only in services. The number of persons in employment remained broadly unchanged in January after a sharp decline in December (due to an increase in retirements and the expiry of fixed-term contracts). The number of unemployed persons declined slightly in March, though the year-on-year decrease was smaller than in previous months. Year-on-year nominal growth in the average gross wage was higher in January than at the end of last year, mainly due to stronger growth in the public sector following the introduction of a new wage system. Year-on-year growth in consumer prices rose in March, returning to the level seen at the beginning of the year (2%). This issue’s selected topic highlights a slight increase in the at-risk-of-poverty rate between 2021 and 2024. Nevertheless, the rate remains below the EU average. However, some vulnerable groups in Slovenia are significantly more exposed to the risk of poverty than the national average in Slovenia and also compared to both the national average and the EU average for these population groups.
Euro area composite purchasing managers’ index (PMI), March 2025

Despite high uncertainty, euro area sentiment indicators improved slightly in the first quarter, pointing to activity growth. In the first quarter, the services PMI stayed above 50 (a level indicating expansion), similar to its level in the fourth quarter of last year. Meanwhile, the manufacturing PMI edged up slightly in the first quarter but remained below 50 (a level indicating contraction). As a result, the composite PMI rose marginally above 50. The euro area economic sentiment indicator (ESI) also increased slightly in the first quarter, driven mainly by higher confidence in industry and, to a lesser extent, in construction. However, on a year-on-year basis, it remained unchanged. Similarly, the Ifo indicator, which measures sentiment in the German economy, improved notably in March, contributing to a slight overall increase in the first quarter.
Commodity prices, March 2025
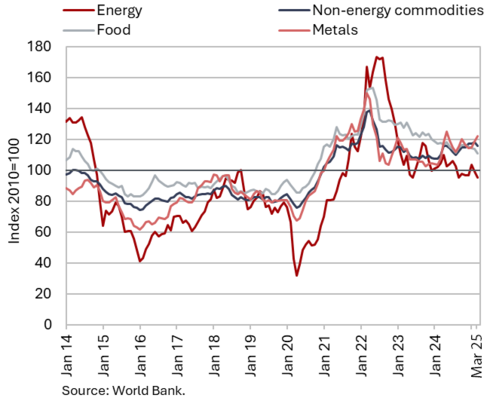
The dollar prices of Brent oil and non-energy commodities decreased slightly on average in March. The average dollar price of Brent crude oil decreased by 3.6% to USD 72.73 in March compared to February and the euro price by 7.1% to EUR 67.31. Year-on-year, the prices of oil in both dollars and euros were about 14% lower. Due to high uncertainty related to US trade policy, the price of oil continued to decrease sharply in early April, reaching its lowest level in the last four years (below USD 65 per barrel). The euro price of natural gas on the European market (Dutch TTF) decreased by 17.1% in March (EUR 41.8), due to milder weather; however, it was still 55.6% higher year-on-year. According to the World Bank, the average dollar price of non-energy commodities fell by 2.1% month-on-month in March, while stood at 5.3% higher year-on-year. In comparison to February, amid falling cocoa prices, the prices of agricultural commodities used for beverages decreased (-9.4%), but they remained significantly higher year-on-year (37.2%). The imposition of tariffs on aluminium and steel imports in the United States further drove up metal prices (by 2% month-on-month and by 10.2% year-on-year).
Effective exchange rate, Q1 2025
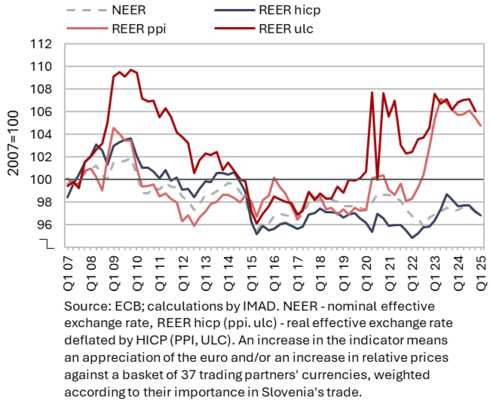
The improvement in price competitiveness indicators continued in the first quarter of 2025, as did the cost competitiveness indicator at the end of 2024 after a temporary deterioration. Both price competitiveness indicators (REER HICP, PPI) have gradually improved since the energy shock, primarily due to the decline in relative prices (Slovenian prices compared to those of its trading partners). Improvements in the cost competitiveness indicator (REER ULC) came to a halt in the first three quarters of 2024, but resumed towards the end of the year. The deterioration in REER ULC in 2024 was temporary and mainly due to an accelerated increase in unit labour costs (ULC) in construction (linked to a decline in construction activity and, consequently, lower productivity in the sector), which slowed down towards the end of the year. In manufacturing, the most export-oriented part of the economy, the (q-o-q) growth in unit labour costs practically came to a standstill in 2024 due to increased productivity.
Short-term indicators of economic activity in Slovenia January−February 2025

Short-term indicators of economic activity in Slovenia indicate weak activity growth in January and February; activity increased month-on-month mainly in trade sectors; compared to the same period last year, exports, turnover in trade and construction were higher, while manufacturing output and turnover in market services were lower. Real exports and imports of goods, which have fluctuated significantly in recent months, declined month-on-month in February. However, both remained higher year-on-year in the first two months (exports increased by 2.0% and imports by 1.2%). Manufacturing production, which had been gradually recovering since the end of the third quarter of last year, contracted in February (-1.8%, seasonally adjusted) and was, on average, also slightly lower year-on-year in the first two months (-0.7%). In a very uncertain international economic environment, sentiment in manufacturing is not improving. After a decrease in wholesale trade and retail sales of non-food products, as well as modest growth in the sales of motor vehicles and retail sales of food products in the fourth quarter of last year, real turnover rebounded sharply in January across all trade sectors. It was also higher compared to January 2024, with the most notable increase in the sales of motor vehicles. After rising in the fourth quarter of last year, total real turnover in market services declined in January due to a downturn in most activities and was also lower year-on-year. After robust growth in November last year, construction activity slightly decreased in December and January. However, due to the low base in January 2024, activity was higher year-on-year this January, marking the first increase in a long time.
Electricity consumption by consumption group, February 2025

Electricity consumption in the distribution network was 0.6% higher year-on-year in February. With the same number of working days, industrial consumption, which serves as an indicator of economic activity, increased by 1.2% year-on-year. Household consumption remained largely unchanged, while small business consumption, which accounts for the smallest share in total consumption, decreased by 1.9% year-on-year.
Trade in goods – in real terms, February 2025
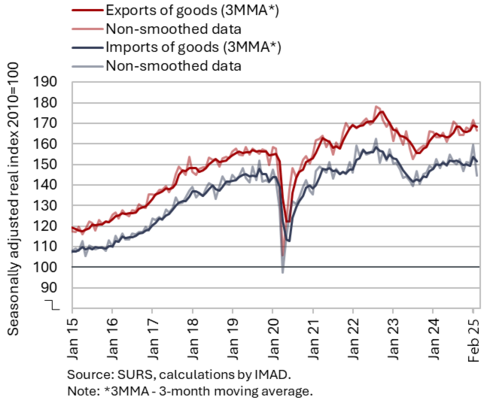
Real exports and imports of goods declined month-on-month in February but remained higher year-on-year in the first two months of this year. In recent months, real exports and imports have continued to fluctuate significantly. After growing in January, real exports fell by 3.2% month-on-month in February, due to lower exports of most main product groups, particularly motor vehicles, while pharmaceutical exports were the only group to increase (seasonally adjusted). Real imports declined by 9.4%, with decreases across all product groups, especially consumer goods (seasonally adjusted). Compared to the same period last year, exports increased by 2.0% and imports by 1.2% in the first two months, though year-on-year export growth slowed significantly in February, while imports even declined.
As in previous months, sentiment in export-oriented activities remained very low in March.
Slovenia’s export market share in the EU market, Q4 2024

Slovenia’s export market share for goods on the EU market increased slightly year-on-year in the fourth quarter of 2024 but growth slowed considerably compared to previous quarters. Quarterly data shows strong growth in the EU market share in the first three quarters of last year (5.5%) and a sharp slowdown in the fourth quarter of last year (0.4%), with the market share of pharmaceuticals and some energy-intensive products (metals, paper and pulp, non-metallic mineral products) continuing to grow. After strong growth in the previous quarters, growth in the market share of road vehicles came to a standstill, while the market share of metal products and certain chemical products declined. A product-specific and geographical breakdown of market share growth shows that in the fourth quarter of last year, the export structure did not differ significantly from the demand structure in the EU. Towards the end of last year, market shares stagnated or fell in most main EU trading partners. However, on average in 2024, they were higher notably in Croatia, France and Germany, while they fell in Austria and Italy. On average in 2024, the EU market share rose by 4.3% year-on-year to 0.49%, following a decline during the epidemic and the energy crisis.
Trade in services – in real terms, February 2025
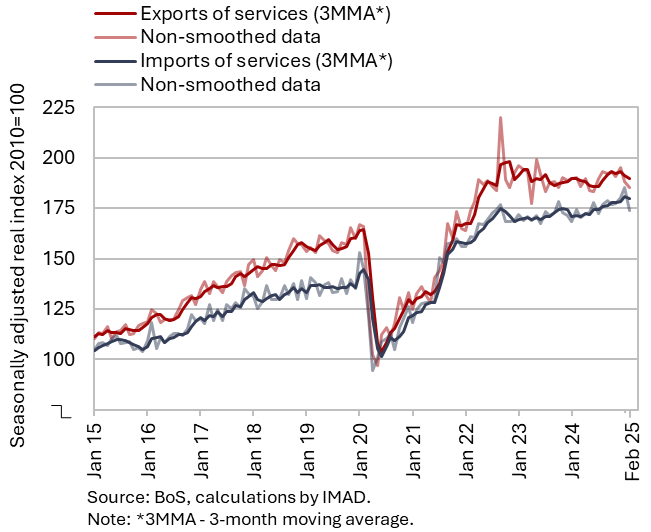
In February, real exports and imports of services declined month-on-month (seasonally adjusted); in the first two months of the year, exports were lower year-on-year, while imports increased. Exports of transport services remained at the same level as in the previous two months, while exports of tourism-related services continued to decline, reaching their lowest level in two years. A significant part of the overall decline in exports was due to lower exports of ICT services and other business services. On the imports side, most major service groups saw a notable decline in February, although imports of other business services fluctuated significantly in the past two months (seasonally adjusted). The year-on-year decline in services exports deepened in February, with exports of construction services falling significantly compared to the same period last year. Imports of services were higher in February and in the first two months overall than a year earlier. This increase was largely driven by higher imports of transport and other business services, while imports of construction services fell considerably, similar to exports.
Production volume in manufacturing, February 2025

Manufacturing production gradually strengthened from the end of the third quarter of last year until January but declined in February (–1.8%, seasonally adjusted). Production contracted across most industry groups by technological intensity. On average in the first two months, production in the high-technology sectors was higher – according to IMAD estimates, primarily due to the pharmaceutical industry. Production also increased in most medium-low-technology industries, with the exception of the manufacture of fabricated metal products. Production in low-technology industries was, on average, similar to that of a year earlier. Output in most medium-high-technology industries was lower year-on-year, with the exception of the energy-intensive chemical industry and manufacture of electrical equipment. Output was also higher in most other energy-intensive industries, while it remained similar to a year ago in the paper industry. On average, manufacturing output in the first two months was slightly lower year-on-year (-0.7%).
In an uncertain international economic environment, sentiment in manufacturing is not improving. Export orders remained low in the first quarter and expectations for production and employment levels have deteriorated slightly.
Activity in construction, January 2025
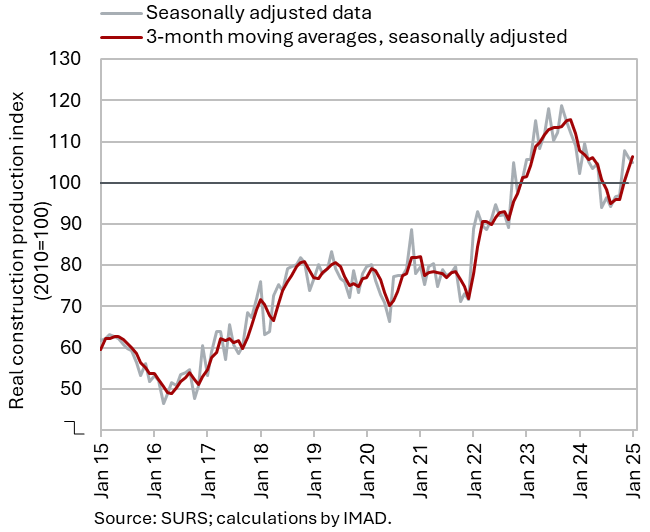
After robust growth in November last year, construction activity decreased slightly in December and January. It had gradually decreased until the summer of last year, then remained at that level from June to October. In November, activity rebounded significantly but dipped slightly again in December and January. Given the summer low, the recovery was strongest in building construction. Activity also increased in specialised construction work, while in civil engineering it remained at similarly low levels as during the summer. Due to the low base in January of last year, it was 4% higher year-on-year this January, marking the first increase in a while.
The lower civil engineering activity was related to government investment. Capital expenditure (based on the consolidated general government budgetary accounts) declined by 9% year-on-year, while expenditure on new construction, reconstruction, and renovation – considered most closely tied to construction activity – fell by 25%. In January, these expenditures increased by 77%, though this has not (yet) been reflected in overall activity.
Turnover in trade, January 2025
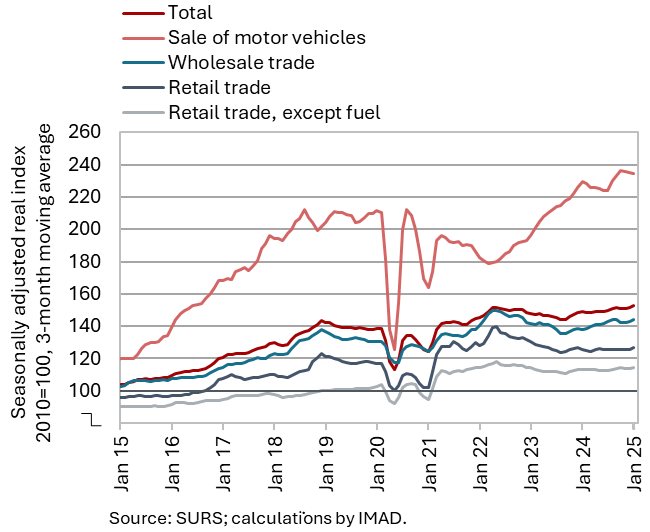
In January, real turnover rose significantly across all trade sectors, rebounding from weaker performance in the fourth quarter of last year. After a decrease in wholesale trade and retail sales of non-food products, as well as modest growth in the sales of motor vehicles and retail sales of food products in the fourth quarter of last year, real turnover rebounded sharply in January across all trade sectors. Turnover in all trade sectors also increased year-on-year, with motor vehicle sales recording the highest growth (3%). This sector also saw the strongest real growth last year (7%), driven by an 8% increase in new passenger car sales.
Turnover in market services, January 2025

In January, total real turnover in market services declined both month-on-month and year-on-year. Following growth in the fourth quarter of last year, turnover fell by 2.5% (seasonally adjusted) in January, due to declines in most activities. After strengthening in the second half of last year, the largest decline in turnover was recorded in accommodation and food service activities. Turnover also fell significantly in administrative and support service activities (particularly in employment agencies), with the negative trend continuing since the second half of last year. After rising in the second half of last year, turnover also fell in transportation and storage, particularly in storage. In information and communication, turnover decreased slightly following a relatively strong increase in the fourth quarter of last year, although sales of computer services increased both in domestic and foreign markets. Following growth in the fourth quarter, turnover growth continued – or even accelerated – only in professional and technical activities. Total real turnover in market services was 1.6% lower year-on-year in January. Real estate activities, administrative and support service activities, and information and communication fell short of the figures recorded in the same month of 2024.
Selected indicators of household consumption, January 2025

The available data indicate that household consumption increased year-on-year at the beginning of 2025. In January, the number of new passenger cars sold to natural persons was 7% higher year-on-year, and turnover from the sales of motor vehicles rose by 3% in real terms. Spending on food, beverages and tobacco products, as well as on non-food products, increased year-on-year, with real turnover rising by 4% and 2%, respectively. Spending on tourism services abroad also increased (nominally by 6%), with the number of overnight stays by Slovenian citizens in Croatia rising by one-fifth year-on-year. In contrast, the number of overnight stays by domestic tourists in Slovenia fell by 1%. The year-on-year growth in household consumption in January is also reflected in the increase in the nominal value of fiscally verified invoices (used as a proxy for sales), amounting to 2% in January. After a weaker February, which saw a 2% year-on-year decline, the value of fiscally verified invoices increased by 1% year-on-year in March. Overall, their total value in the first quarter was approximately at the same level as in the first quarter of last year.
Real estate, Q4 2024
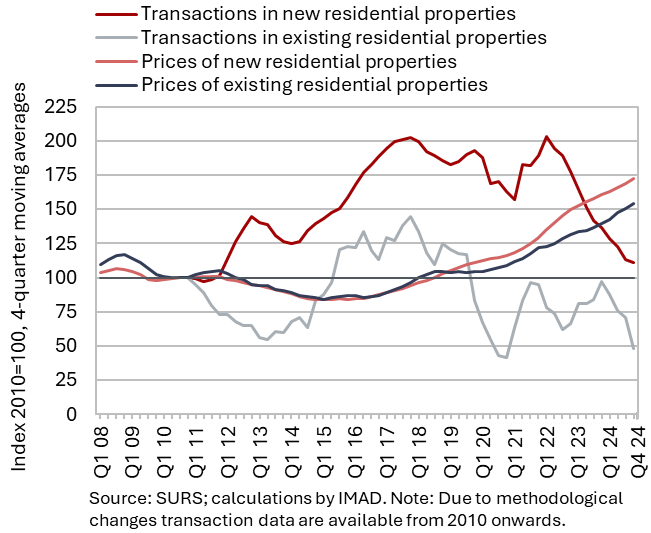
Amid a continued decline in sales volume, home prices continued to rise last year. After an average increase of 14.8% in 2022, price growth halved in 2023 and remained largely unchanged in 2024 (7.4%). Prices of existing homes – where the number of transactions fell to its lowest level since 2011, down almost one-fifth year-on-year – rose by 7.4%, a similar rate to the previous year. Prices of newly built homes increased by 10% (compared to an average growth of 6.6% in 2023), though these accounted for only 5% of total transactions. On average, home prices were 101.5% higher their 2014 low, with existing homes up by 105.7% and newly built homes up by 80.3%.
Economic sentiment, March 2025
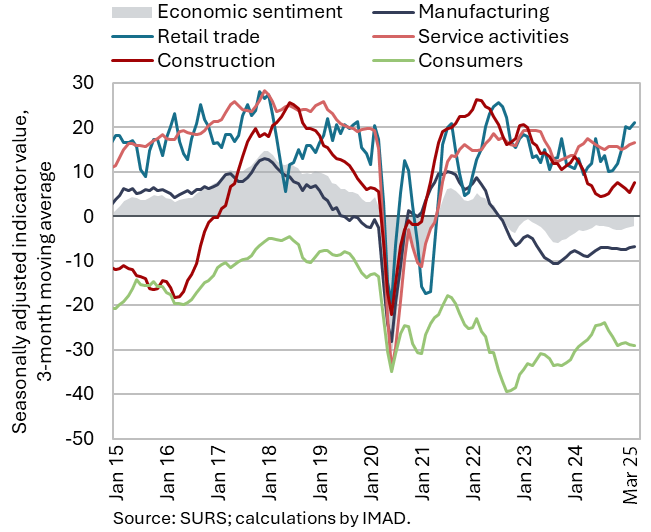
The economic sentiment indicator continued to rise month-on-month in March and was also higher year-on-year. Confidence indicators improved month-on-month in retail trade, construction and among consumers. Meanwhile, the confidence indicator in manufacturing, which had been strengthening since the start of the year, declined in March. The confidence indicator in services also declined slightly month-on-month. Year-on-year, the confidence indicator in March was higher among consumers and in all activities except for services, where it fell for the second consecutive month.
Households facing financial distress, March 2025
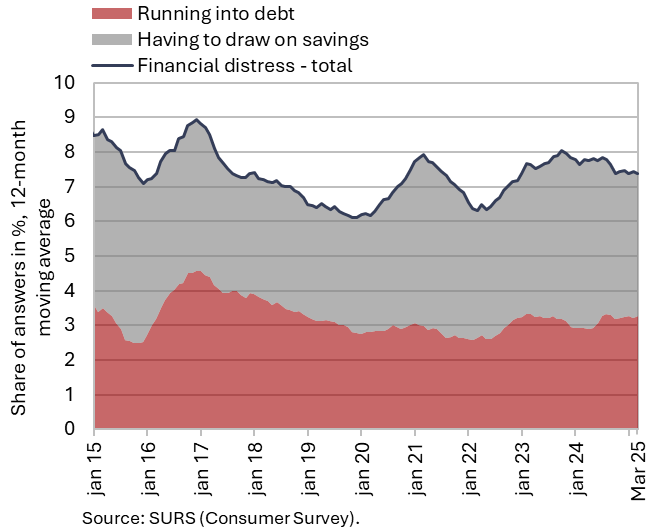
In the first quarter of this year, the financial situation of households deteriorated slightly compared to the previous month but improved slightly year-on-year. Compared to the fourth quarter of last year, the overall financial situation of households deteriorated slightly, except for households in the lowest income quartile, where conditions improved (the share of households in this group facing financial distress fell by 1.7 p.p. to 12.3%). Year-on-year, their financial situation remained largely unchanged. The share of households experiencing financial distress and having to draw on savings to meet their needs fell slightly year-on-year, while the share of those running into debt remained unchanged. According to IMAD’s estimates, this was partly supported by favourable developments in the labour market, including high employment and rising wages.
Number of persons in employment, January 2025

After a significant decline in December 2024, the number of persons in employment remained largely unchanged in January (down by 0.3% year-on-year). After stagnating for most of last year, the sharp decline in December is attributed to increased economic uncertainty and a notable rise in the number of retirements and non-renewal of fixed-term contracts, which is typical at the end of the year. In January, the total number of persons in employment rose slightly month-on-month (seasonally adjusted) but remained lower year-on-year in manufacturing (-1.6%) and administrative and support service activities, including employment agencies (-18.1%). For the first time since 2020, the number of persons in employment also decreased year-on-year in construction (-0.7%). However, employment increased in public service activities, such as healthcare (3.0%) and education (1.6%).
Number of registered unemployed, March 2025
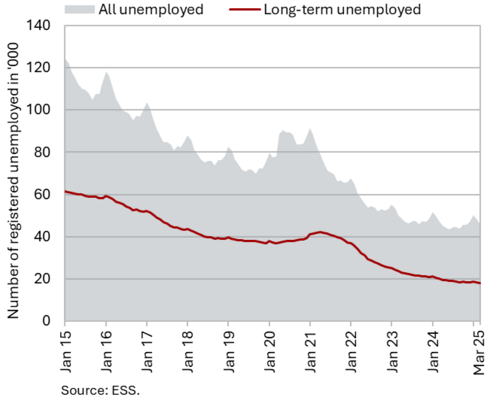
In March, the number of unemployed persons (seasonally adjusted) declined slightly by 0.2%. According to original data, 45,851 people were unemployed at the end of March, 5% fewer than at the end of February. Year-on-year, unemployment was 2.2% lower, although the decline was slightly smaller than in previous months. Amid persistent labour shortages and the retirement of older employees, the number of long-term unemployed (those unemployed for more than one year) and those over the age of 55 fell year-on-year at the end of March, by 9.9% and 11.5% respectively. In contrast, youth unemployment (ages 15–29) increased year-on-year by 4.5% for the sixth month in a row.
Average nominal gross wage per employee, January 2025

Year-on-year nominal growth of the average gross wage was higher in January (6.9%) than at the end of last year, primarily due to stronger growth in the public sector following the implementation of the new wage system. In this sector, wages rose by 10.2% year-on-year in January, driven by the first instalment of the agreed wage increase. Growth in the private sector was higher (5%) than in December last year but lower than in previous months. In IMAD’s view, this could be partly due to increased economic uncertainty and partly to the lower minimum wage increase at the beginning of this year compared to last year.
In real terms, the average gross wage increased by 4.8% in January – 2.9% in the private sector and by 8% in the public sector.
Number of FSA beneficiaries and UB recipients, January 2025

In January, the numbers of financial social assistance (FSA) beneficiaries and of unemployment benefit (UB) recipients were lower year-on-year. According to original data, 16,322 people received UB in January, 21.7% more than in December. This largely reflects seasonal trends related to a higher inflow into unemployment due to expiry of fixed-term employment contracts. Year-on-year, the number of UB recipients fell by 6% (32.5 of all unemployed, compared to 33.6% of all unemployed in January last year). Amid high employment levels and a decline in the number of long-term unemployed – who are often eligible for FSA – the number of FSA beneficiaries continued to fall year-on-year, reaching one of the lowest levels in the past decade. In January, 71,385 people were entitled to FSA, 2.5% fewer than in the same month of 2024.
Consumer prices, March 2025
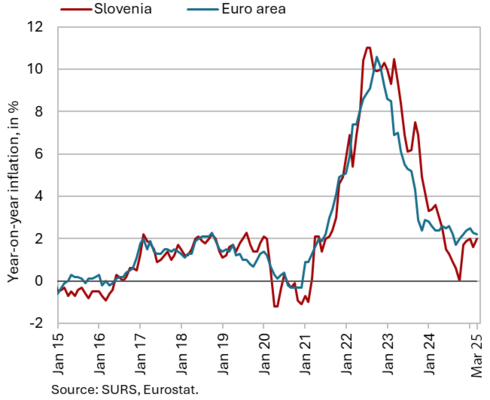
Year-on-year growth in consumer prices increased by 0.4 p.p in March compared to February, returning to the level seen at the beginning of the year (2%). The main contributor to the higher year-on-year inflation this time was the increase in electricity prices, which rose by 16.5% month-on-month. This was due to the expiry of a temporary partial reduction in electricity network charges. This monthly increase was mitigated somewhat by the transition to the low season for network charge calculation, as well as the extension of the exemption from the RES and CHP contribution. Year-on-year price growth also strengthened slightly in food and non-alcoholic beverages (3.5%) and semi-durable goods (2.2%), where above-average seasonal price increases were recorded in clothing and footwear. Service price growth also increased slightly (3.4%). On the other hand, the decline in durable goods prices (-0.8%) intensified slightly compared to the first two months of the year. The highest year-on-year price increase was recorded in the health group (5.4%), with more than half of this growth resulting from a 2.8% monthly increase in March.
Slovenian industrial producer prices, February 2025
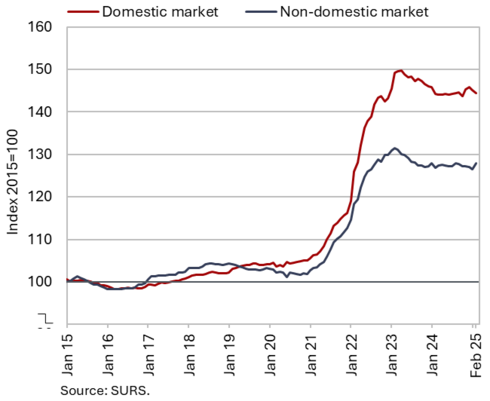
Slovenian industrial producer prices were 0.5% higher year-on-year in February, marking the first increase after more than a year of decline. In addition to a 0.4% monthly rise, this was also driven by a lower base. Prices increased year-on-year in the domestic market (0.2%) and even more so in foreign markets (0.9%). Broken down by industrial group, consumer goods prices rose year-on-year, with non-durable goods standing out, increasing by 3.6%. Durable goods prices remained almost unchanged year-on-year (0.2%). Prices declined in the energy (-2.6%), capital goods (-0.5%), and intermediate goods (-0.3%) categories. However, the downward trend in intermediate goods prices continues to moderate gradually.
Loans to domestic non-banking sectors, February 2025

Since mid-2024, growth in the volume of loans to domestic non-banking sectors has been gradually strengthening, reaching 7.6% year-on-year in February. The largest contributions to this growth (each accounting for 3.2 p.p.) came from a nearly 70% increase in loans to non-monetary-financial institutions (NFIs) and a 6.2% increase in household loans. The composition of household loan growth is shifting slightly: although consumer loan growth remains relatively high at 13.3%, it is gradually slowing, partly due to a slightly faster pace of deleveraging and a higher base in February last year. Growth of housing loans continues to strengthen gradually, reaching 4.5%. After two years of decline, lending to non-financial corporations has started to recover this year amid continued monetary policy easing. In February, it recorded year-on-year growth (2%) for the first time since July 2023. Deposit growth in the domestic non-bank sector has also picked up this year, reaching 3.5% – the highest rate since 2023. The quality of banks’ assets remains solid, with the share of non-performing loans stable at 1%.
Bond, Q1 2025
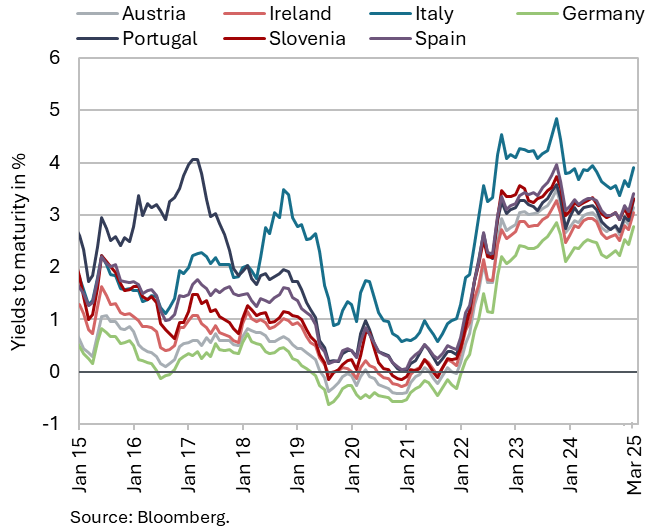
Yields to maturity of euro area government bonds rose in the first quarter of this year. Yields rose following the announcement of a more expansionary fiscal policy in Germany, which also affected bond yields in other countries. The ECB, meanwhile, cut key interest rates twice during this period as inflationary pressures eased. Quarter-on-quarter, the yield to maturity of the Slovenian government bond increased by 15 basis points, reaching 3.13%. However, the spread to the German bond decreased by 17 basis points, to 55 basis points.
Current account of the balance of payments, February 2025

The 12-month current account surplus (up to February) amounted to EUR 2.8 billion, or 4.0% of estimated GDP, slightly lower than the EUR 2.9 billion recorded in the previous 12-month period. This decline was driven by the goods trade balance and the secondary income balance. The higher goods deficit was the result of higher import growth than export growth, while the higher secondary income deficit was mainly due to lower government revenues. The services surplus remained high, increasing primarily in trade in technical trade-related services and transport services. The decline in the primary income deficit was mostly due to higher subsidies from the EU budget and lower net outflows of income from equity capital (dividends and profits).
Revenue (top figure) and expenditure (bottom figure) of the consolidated general government budgetary accounts, February 2025


In the first two months of 2025, the deficit of the consolidated general government budgetary accounts amounted to EUR 17.1 million, compared to a surplus of EUR 219.7 million in the same period last year. Revenue in the first two months was 5.8% higher year-on-year. The main contributors to revenue growth were tax revenues, particularly corporate income tax – driven mainly by a higher tax rate – followed by VAT revenue and, to a lesser extent, personal income tax revenue. Revenue growth from social contributions, which was boosted significantly last year by the transformation of the complementary health contribution into a mandatory one, is lower this year but remains relatively high due to continued growth in wages and employment. Total receipts from the EU budget were lower year-on-year. Expenditure in the first two months was 12.1% higher year-on-year. The main drivers of this increase were current transfers (particularly agricultural subsidies, which were low in the same period last year), wages and work-related income affected by the wage reform introduced in January this year, and transfers to individuals and households, where most of the increase stemmed from expenditure on pensions and sickness benefits. Investment expenditure was higher year-on-year. Interest payments and payments to the EU budget and to reserves (budget fund allocations), which were down in the same period last year, also increased.
EU budget receipts, February 2025 (top figure) and Absorption of 2021–2027 funds under the Cohesion policy programme (EU part) for the period 1 January 2021–28 February 2025 (bottom figure)
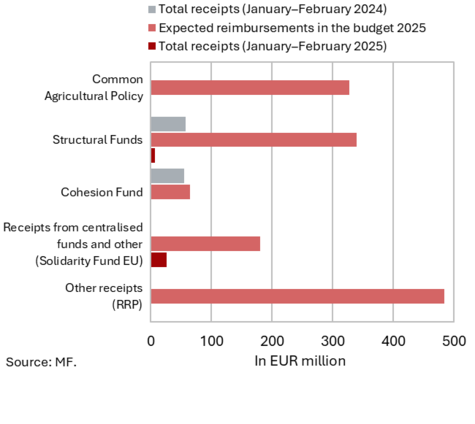

In the first two months of 2025, Slovenia’s net budgetary position vis-à-vis the EU budget was negative, amounting to EUR 86.9 million. During this period, Slovenia received EUR 32.5 million from the EU budget (2.3% of receipts envisaged in the adopted state budget for 2025) and paid in EUR 119.4 million it (16.3% of planned annual payments). The bulk of receipts (81.9% of all reimbursements to the state budget, 14.8% of the planned reimbursements in 2025) were resources from the EU budget for the implementation of centralised and other EU programmes (primarily from the Connecting Europe Facility) and from structural funds (19.6% of all reimbursements to the state budget, 1.9% of the planned reimbursements in 2025). Receipts for the implementation of the Common Agricultural and Fisheries Policies amounted to 0.3% of all reimbursements (0.03% of the planned reimbursements in 2025). The highest payments into the EU budget came from GNI-based payments (52.4 % of all payments).
According to MKRR data, under the Operational Programme for the Implementation of EU Cohesion Policy 2021–2027 (from January 2021 to the end of February 2025), payments from the state budget totalled EUR 77.9 million (EU share), representing 3% of the available funds.