
Slovenian Economic Mirror
Slovenian Economic Mirror 6/2026
Growth in economic activity in Slovenia moderated somewhat during the summer months, both in export-oriented activities and in most sectors linked to domestic production and investment. Goods exports in July and August were, on average, lower than in the second quarter, while manufacturing production resumed growth following a contraction in June. Despite the summer slowdown, goods exports and industrial production were considerably higher year-on-year in the first eight months, with growth remaining relatively broad-based; exports of pharmaceutical products and road vehicles continued to increase. Export competitiveness also improved in the first half of the year amid easing pressures on cost and price competitiveness. Growth in construction activity moderated following a strong acceleration at the beginning of the year. Turnover in trade generally declined in recent months, particularly in wholesale trade, while turnover in market services also decreased; only accommodation and food service activities recorded an increase, supported by growth in overnight stays by foreign tourists. According to the available data, year-on-year growth in private consumption in the third quarter strengthened across all segments, particularly in purchases of new passenger cars. Economic sentiment has improved since reaching a low in April and was higher in September than a year earlier and above its long-term average. In the labour market, amid high employment, the decline in the number of unemployed persons has accelerated somewhat since the middle of the year, while wage growth has remained high, supported by low unemployment, favourable economic developments and the implementation of the public sector pay reform. Inflation increased slightly further in September (to 3.3%). Energy prices, which have been rising amid geopolitical tensions and supply disruptions, again made the largest contribution to consumer price inflation. Prices of food and non-alcoholic beverages remained lower year-on-year, following another month-on-month decline.
Composite Purchasing Managers’ Index (PMI) for the euro area, September 2026
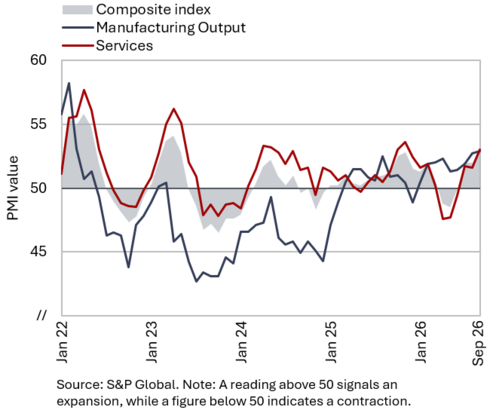
Economic sentiment indicators point to growth in euro area activity in the third quarter amid increasing price pressures. In September, the composite Purchasing Managers’ Index (PMI) for the euro area reached its highest level since April 2023. Averaging 52.4 in the third quarter, the index also pointed to continued growth in economic activity. Growth was broad-based, with the index improving in both manufacturing and services. Demand strengthened, particularly export demand, while companies again reported an increase in employment in the PMI survey. At the same time, price pressures intensified, mainly due to higher import prices and an acceleration in services price growth. The Economic Sentiment Indicator (ESI) for the euro area declined slightly in September amid weaker consumer confidence, but its third-quarter average was higher than in the second quarter (seasonally adjusted) and than in the same period last year. Indicators for Germany (PMI, ZEW and ifo) also point to a continued improvement in economic conditions in recent months, particularly in services. The ifo indicator, which measures sentiment in the German economy, rose further in September, reflecting a more favourable assessment of the current situation and improved business expectations. According to ZEW, stronger-than-expected economic growth, which has led to upward revisions to growth forecasts for this year, is contributing to greater optimism. Sentiment has improved particularly in the financial and energy sectors and in the chemical and pharmaceutical industries, while conditions in the automotive industry remain uncertain, according to ifo.
IMF’s autumn outlook, October 2026
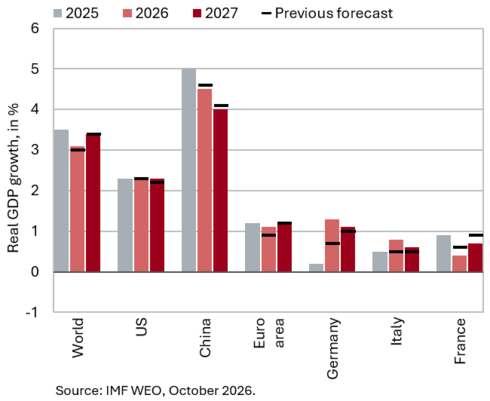
In October, the IMF revised its forecast for global economic growth this year slightly upwards, reflecting the greater resilience of the global economy, although growth is still expected to be lower than last year. Global economic growth in the first half of the year exceeded expectations, as the negative effects of the conflict between the US and Iran, higher energy prices and trade tensions were mitigated by adjustments to supply routes, increased use of inventories and fiscal measures. Strong investment activity, particularly in the technology sector, in connection with artificial intelligence (AI), also provided additional support. However, according to the IMF, the scope for further adjustments is becoming increasingly limited, while the medium-term growth outlook remains less favourable. Among the key downside risks, the IMF highlights a further escalation of conflicts and trade tensions, a potential reassessment of expectations regarding the impact of artificial intelligence, and fiscal vulnerabilities. Global economic growth is projected to slow from 3.5% last year to 3.1% this year (compared with 3.0% in the July forecast), before strengthening to 3.4% in 2027. For the US, it forecasts growth of 2.3% in both years. As a net energy exporter, the US is less directly exposed to the adverse energy shock. The IMF also revised its forecasts for the euro area slightly upwards, although growth is expected to remain relatively subdued (1.1% this year and 1.2% in 2027). Owing to higher energy prices and weak consumer confidence, the recovery is expected to be slower than in the US despite fiscal stimulus measures, while the energy shock has also led to renewed inflationary pressures. The growth forecast for Germany was revised upwards considerably for this year, to 1.3% (by 0.6 p.p. compared with July 2026), supported by higher government consumption and investment, particularly in infrastructure and defence. For next year, the IMF expects GDP growth of 1.1%.
Commodity prices, September 2026 (top figure) and diesel crack spread (Brent) (bottom figure)
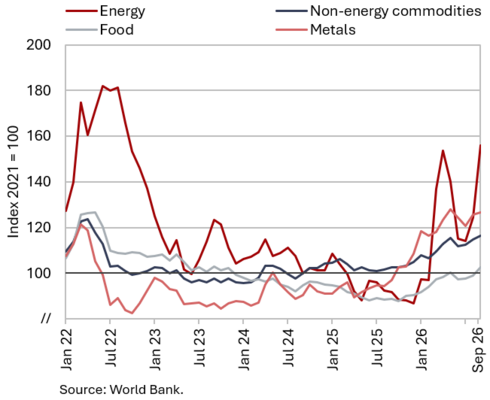
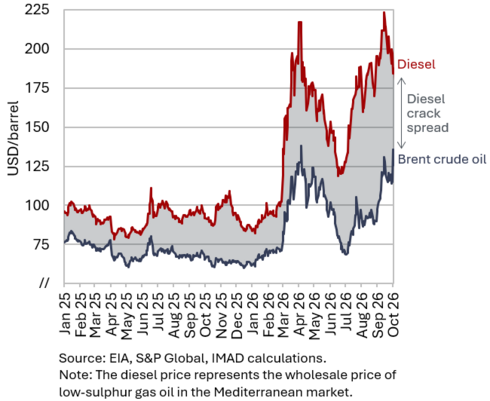
Commodity prices rose in September and were considerably higher year-on-year, with energy prices recording the sharpest increases. The average dollar price of Brent crude oil rose by 25.3% month-on-month in September to USD 114.1, while the euro price increased by 26.1% to EUR 99.1, bringing both close to their April levels. Year-on-year, the dollar price of Brent crude oil increased by 68%, while the euro price rose by 71%. The average euro price of natural gas on the European market (Dutch TTF) increased for the third consecutive month (by 3.6% to EUR 72.36/MWh), reaching its highest level since December 2022. Compared with a year earlier, it was 130% higher. The rise in oil and natural gas prices was driven by the further escalation of the conflict between the US and Iran, disruptions to energy shipments from the Persian Gulf, a sharp increase in demand from Asian countries and attacks on energy infrastructure in Saudi Arabia, which also temporarily restricted some alternative export routes. Since the outbreak of the conflict, the difference between wholesale petroleum product prices, particularly diesel prices, and the price of Brent crude oil has also more than doubled, contributing to faster increases in retail prices for petroleum products. Upward pressure on gas prices is also being exacerbated by relatively low European gas storage levels. At the end of September, storage facilities were around 71% full, approximately 10 p.p. below the level a year earlier and 15 p.p. below the five-year average.
According to the World Bank, the average dollar price of non-energy commodities also increased in September, by 1.3% month-on-month and 13.6% year-on-year. Food prices (particularly cereals) recorded the largest monthly increase, while prices of metals and some agricultural raw materials also rose.
Effective exchange rates, Q2 (REER ulc) and Q3 2026 (REER hicp, ppi)
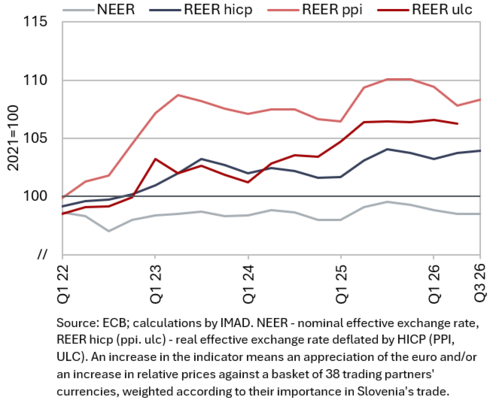
Since mid-2025, pressures on the cost and price competitiveness of the Slovenian economy have eased, although data for the third quarter of 2026 point to a slight deterioration in price competitiveness. The sharp deterioration in cost competitiveness in 2025 (an increase in REERulc) was largely attributable to relatively high growth in nominal unit labour costs (NULC) in manufacturing (reflecting slower productivity growth amid declining activity) and public services (reflecting accelerated labour cost growth associated with the implementation of the public sector pay reform). The increase in NULC in 2025 was also reflected in a deterioration in price competitiveness indicators, REERhicp and particularly REERppi, which reflects the price competitiveness of manufacturing. From mid-2025 onwards, pressures on competitiveness eased. The deterioration in cost competitiveness came to a halt, with unit labour cost growth remaining relatively high only in public service activities (due to the implementation of the pay reform), while developments in other groups of activities were similar to or more favourable than at the EU level. As regards price competitiveness, the REERppi indicator in particular improved considerably, especially in the first half of 2026, although data for the third quarter point to a slight reversal.
Short-term indicators of economic activity in Slovenia, July–August 2026
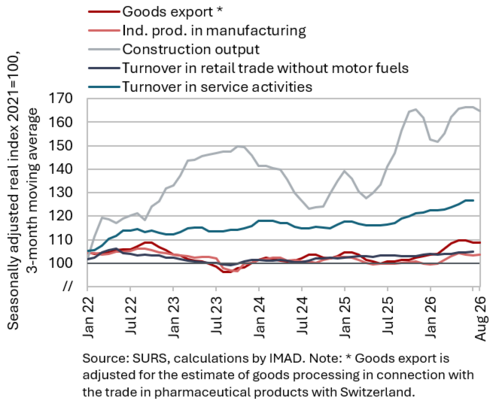
Growth in activity in most sectors slowed during the summer months, activity remained above year-earlier levels. Real goods exports in July and August were, on average, slightly lower than in the second quarter. Exports of machinery and equipment n.e.c. declined in particular, while exports of pharmaceutical products, road vehicles and other chemical products continued to increase. In the first eight months, goods exports were higher year-on-year, with growth being broad-based. Production was also higher year-on-year in most manufacturing industries during this period. In recent months, the continued month-on-month increase in manufacturing production was mainly driven by accelerating growth in medium-high-technology industries, partly reflecting the start of production of electric passenger cars. Following strong growth at the beginning of the year, construction activity moderated around the middle of the year and declined considerably in August, but remained higher year-on-year. In the first eight months, it was around one-fifth higher than a year earlier. Turnover in trade generally declined in recent months up to July, mainly due to a decrease in wholesale trade. Following strong growth in the second quarter, turnover in market services also declined in July, with further growth recorded only in accommodation and food service activities, supported by an increase in overnight stays by foreign tourists. Nevertheless, turnover in trade and market services was higher in the first seven months than in the same period last year.
Trade in goods – real, August 2026
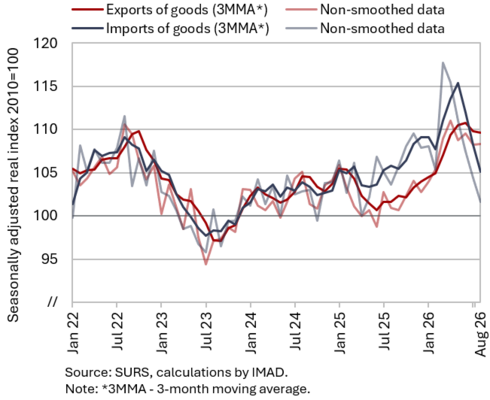
Goods exports remained virtually unchanged month-on-month in August, while imports declined further; both were higher than a year earlier. Following growth in the second quarter, real goods exports declined in July and remained almost unchanged in August (+0.1%, seasonally adjusted). As a result, their average level in July and August was lower than in the second quarter. Among the main product groups, exports of pharmaceutical products, road vehicles and other chemical products continued to increase in July and August. By contrast, exports of other machinery and equipment (e.g. power-generating machinery and equipment) declined in particular. Imports declined for the fifth consecutive month in August (by 2.6%, seasonally adjusted), mainly due to lower imports of capital and consumer goods. Imports of intermediate goods increased, however, indicating greater demand for production inputs. With one more working day than in the same period last year, exports and imports were higher year-on-year in the first eight months (by 6.8% and 5.2% respectively), with growth remaining broad-based.
Amid improving sentiment in manufacturing among Slovenia’s main trading partners, as also reflected in the Purchasing Managers’ Index (PMI), export orders increased again in September, reaching their highest level since the beginning of 2023.
Slovenia’s export market share of goods in the EU market, Q2 2026
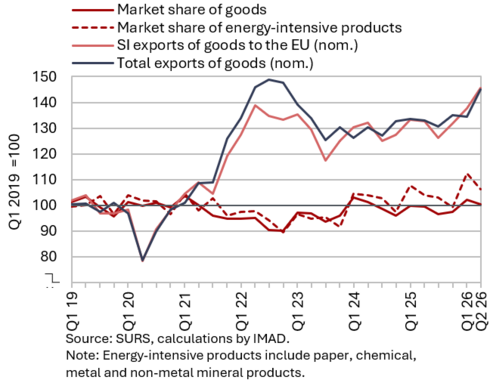
Following a decline last year, Slovenia’s goods export market share in the EU increased by 1.6% year-on-year in the first half of 2026. In both quarters, the market share of pharmaceutical products continued to increase year-on-year. The market shares of miscellaneous manufactured products (scientific and controlling instruments and apparatus) and energy-intensive products (chemical products, non-metallic mineral products and metals) were also higher, with the exception of paper and pulp. The market share of other machinery and equipment (industrial machinery and equipment, electrical machinery and equipment) was lower year-on-year. The export market share of road vehicles in the first half of the year was similar to its level a year earlier, but increased in the second quarter, mainly due to higher exports of electric vehicles. In the first half of the year, Slovenia’s market share increased more markedly year-on-year in France (mainly due to higher exports of electric vehicles) and Italy, declined in Austria and Germany, and remained unchanged in Croatia. Product and geographical decompositions of the year-on-year growth in Slovenia’s export market share in the EU market indicate that this year’s increase was mainly attributable to improved export performance in individual product categories. The effect of export composition on the change in the overall market share was not pronounced this time.
Trade in services – in real terms, August 2026
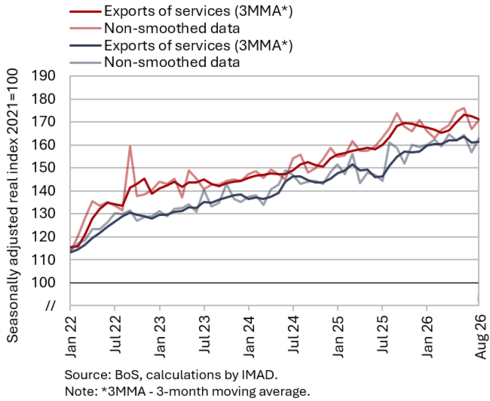
Real exports and imports of services increased month-on-month in August and were both higher year-on-year in the first eight months. Following a decline in July, exports of services increased again in August (by 2.0%, seasonally adjusted), with all major service categories contributing to growth (particularly exports of ICT and other business services), with the exception of construction services. Imports of services also increased month-on-month (by 4.2%, seasonally adjusted), particularly imports of travel services. Although year-on-year growth in trade in services slowed somewhat in the last two months, both exports and imports of services were higher year-on-year in the first eight months (by 3.0% and 5.0%, respectively). The year-on-year increase was broad-based, with trade in other business services and transport services contributing the most to growth. Exports and imports of travel services were also noticeably higher. During this period, Slovenia's main export markets for services were Germany and Austria (12.0% each), Italy (8.6%) and, outside the EU, Switzerland (8.3%).
Production volume in manufacturing, August 2026
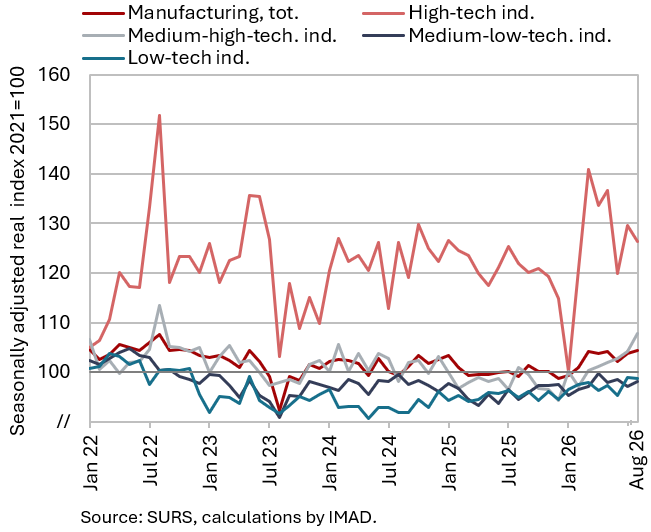
Manufacturing production increased again in August (seasonally adjusted) and was 2.7% higher year-on-year in the first eight months. Growth in production in medium-high-technology industries has accelerated further since mid-year, supported, in our assessment, mainly by the manufacture of motor vehicles, trailers and semi-trailers (following the start of production of electric passenger cars). Production in high-technology industries remained at a relatively high level despite considerable monthly fluctuations, while production in medium-low- and low-technology industries has increased only modestly this year (all seasonally adjusted). In the first eight months, production in most manufacturing industries was higher than a year earlier. Production was higher year-on-year in most high- and medium-high-technology industries (except the manufacture of electrical equipment and the energy-intensive chemical industry). Production increased more markedly in the manufacture of motor vehicles, trailers and semi-trailers, which had contracted over the previous four years, and in the manufacture of machinery and equipment, which had declined over the past two years. Production in the pharmaceutical industry, which fluctuates considerably from month to month, was, in our assessment, slightly higher in the first eight months than in the same period last year. Production in the energy-intensive manufacture of non-metallic mineral products and basic metals also exceeded year-earlier levels, as did production in other medium-low-technology industries. Production was lower year-on-year in most low-technology industries and slightly lower in the energy-intensive paper industry.
Activity in construction, August 2026 (top figure) and prices in construction (bottom figure)
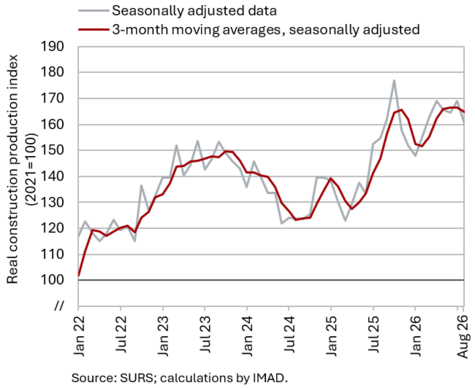
The value of construction work declined sharply in August and, against a high base in the same month last year, was only 4% higher year-on-year... Following strong growth at the beginning of this year, the value of construction work fluctuated considerably around the middle of the year, declining sharply in August (by 5% month-on-month). At the same time, owing to the strong acceleration in construction activity in the second half of last year, year-on-year growth was considerably lower in August. While the value of construction work was 23% higher year-on-year in the first half of the year, it was only 4% higher in August.
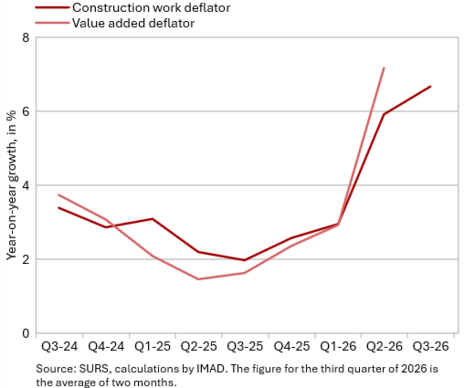
...while year-on-year growth in construction services prices remained high. The implicit deflator of the value of construction work (which measures construction prices) stood at 6.6% in August, while the value added deflator in construction rose to 7.2% in the second quarter (more recent data are not yet available). The high level of the value added deflator suggests that prices of construction services are rising faster than input costs, or that profit margins in the construction sector are increasing amid strong demand.
Value of fiscally verified invoices, in nominal terms, September 2026
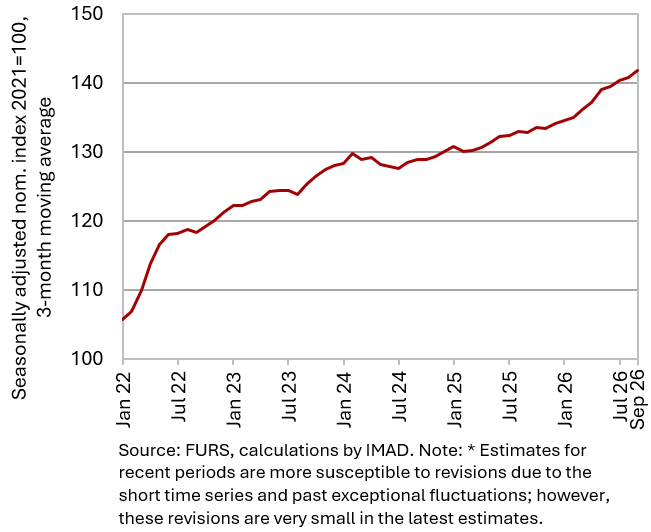
The nominal value of fiscally verified invoices continued to increase in September (seasonally adjusted), and year-on-year growth also remained relatively high (7%). Year-on-year growth stood at 7% in September and on average in the third quarter, compared with around 5% in the first two quarters (real year-on-year growth doubled from 2% in the first and second quarters to 4% in the third). In trade, which accounted for almost three-quarters of the total value of fiscally verified invoices, year-on-year growth remained high (8%). While growth in retail trade remained relatively strong (7%), growth in the nominal value of fiscally verified invoices in wholesale trade accelerated (from 5% in August to 10%). Among the main retail trade sectors, particularly strong growth was recorded in sales of motor fuels (28%), mainly due to higher petroleum product prices, and in sales of clothing, footwear, pharmaceutical and medical products (10%). Following strong growth in previous months, growth in sales of motor vehicles, motorcycles and related parts and accessories slowed markedly (from an average of 8% in previous months to 1%). Growth in retail trade in non-specialised stores strengthened slightly (to 5%). This sector accounted for a quarter of the total value of fiscally verified invoices. Growth in accommodation and food service activities also remained relatively high (11%), while growth in cultural, sports, recreational and other activities slowed considerably (from 9% in August to 3%).
Turnover in trade, July 2026
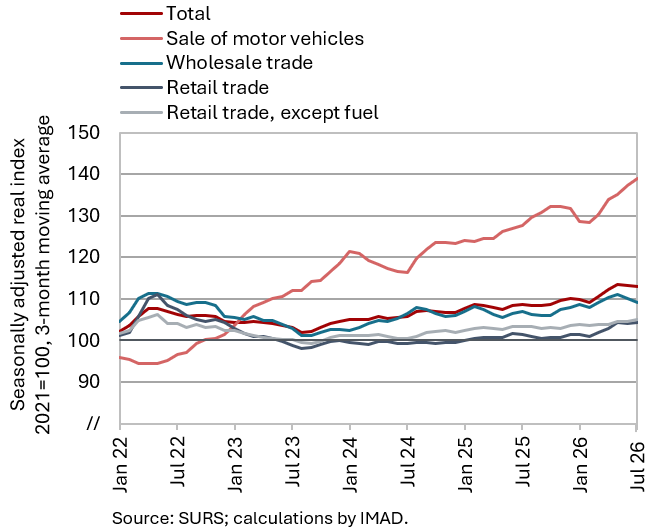
Sales in trade declined somewhat in recent months (in real terms, seasonally adjusted), but remained higher year-on-year in the first seven months. Following strong growth at the beginning of the year, sales declined in recent months, mainly due to lower wholesale sales, which fell for the fourth consecutive month in July after strong growth in March. In July, real turnover continued to increase in motor vehicle trade and retail trade in non-food products. Turnover in retail trade in food, beverages and tobacco products declined, although it has fluctuated around its 2021 average over the past three years (all seasonally adjusted). Year-on-year, sales in the first seven months were lower only in retail trade in food, beverages and tobacco products (by 1%). In motor vehicle trade, sales increased by 7% year-on-year, while wholesale trade and retail trade in non-food products each recorded growth of around 3%.
Turnover in market services, July 2026
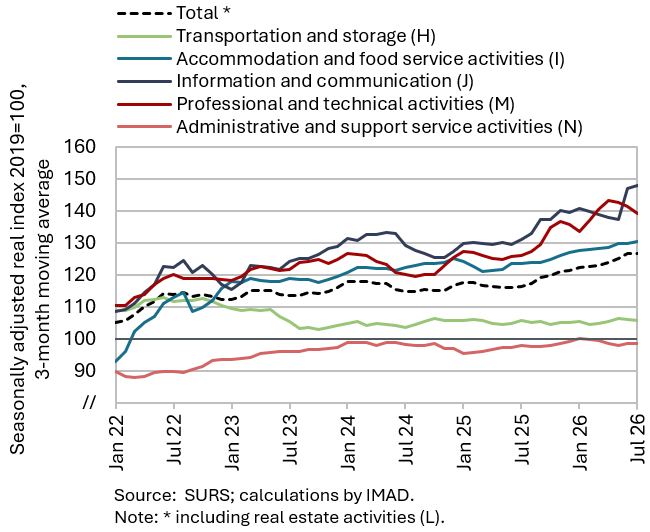
Total real turnover in market services declined in July (seasonally adjusted), after strong growth in the second quarter, but remained higher year-on-year. Following earlier growth, turnover declined in professional and technical activities and in information and communication. It continued to decline in administrative and support service activities, most significantly in employment services, as well as in transportation and storage. Amid continued growth in overnight stays, particularly by foreign tourists, only turnover in accommodation and food service activities increased (all seasonally adjusted). In the first seven months, total real turnover was 7.3% higher year-on-year. The largest increase was recorded in professional and technical activities (11.6%).
Road and rail freight transport, Q2 2026
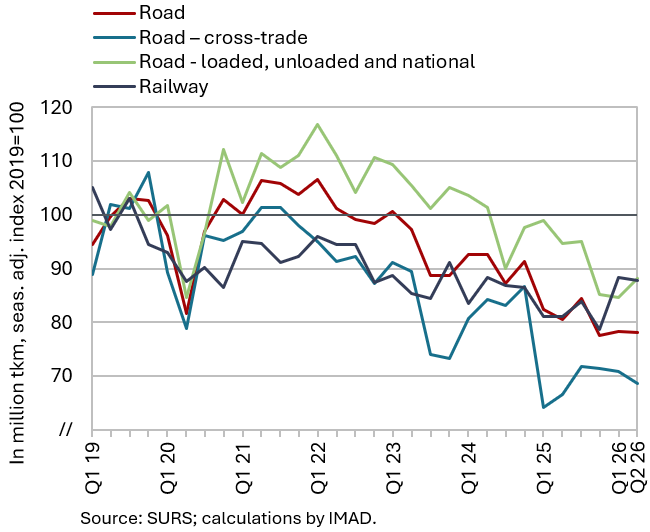
In the second quarter of 2026, the volume of road and rail freight transport, which has generally been declining since 2022, remained largely unchanged quarter-on-quarter. In road freight transport performed by Slovenian vehicles, the volume of cross-trade declined further (by 3%) and remained further below its 2019 level than transport taking place at least partly on Slovenian territory (exports, imports and national transport). The latter increased by 4% quarter-on-quarter. The share of cross-trade in total transport remained at 43%, below its pre-pandemic level (50% in the second quarter of 2019). In contrast to road freight transport, rail freight transport on Slovenian territory was considerably higher year-on-year (by 8%, compared with a 3% decline in road transport), owing to strong growth in the first quarter. Nevertheless, it remained significantly below its level in the corresponding period of 2019 (by one-tenth).
Selected indicators of household consumption, Q3 2026
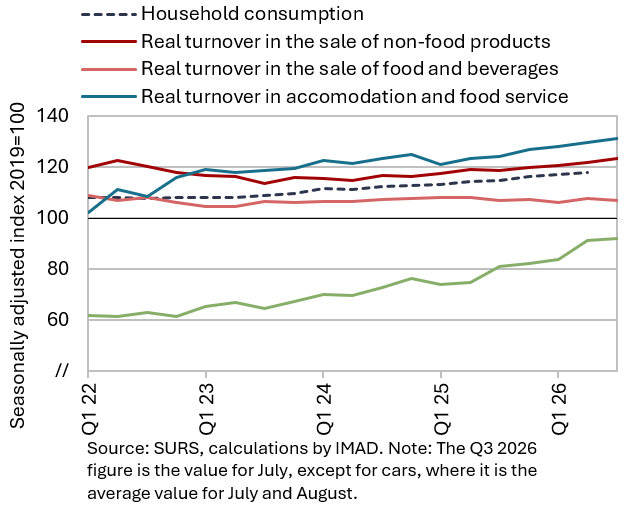
Available data for the third quarter point to higher year-on-year growth in household consumption than in the first half of the year, when it stood at 3.4%. Growth in household spending on non-food products doubled to 5% in July compared with the average for the first two quarters. Following a decline in the first half of the year, turnover in retail trade in food, beverages and tobacco products was also higher year-on-year (by 1%). Strong growth in purchases of new passenger cars continued, standing at 26% year-on-year in July and August (compared with 29% in the second quarter). Spending on tourism services abroad was also slightly higher year-on-year in these two months (by 2% in nominal terms), while the number of overnight stays by domestic tourists in Slovenia was similar to last year's level. The value of fiscally verified invoices (used as a proxy for final sales of goods and services) also points to stronger growth in household consumption. Its real year-on-year growth doubled to 4% in the third quarter.
Real estate, Q2 2026
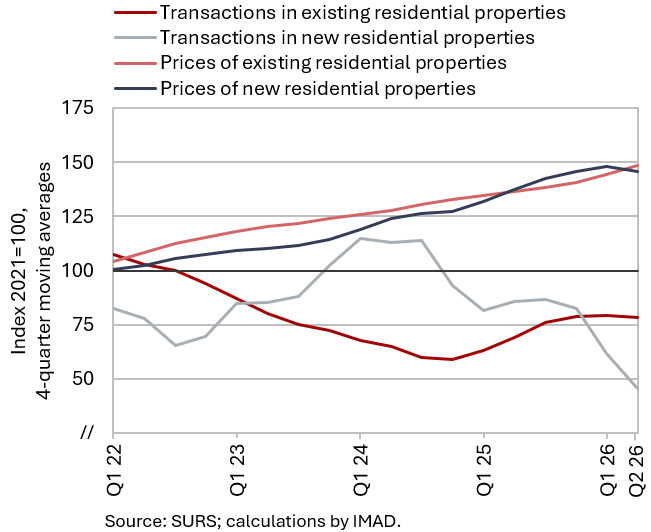
Year-on-year growth in dwelling prices remained high in the second quarter of 2026, while the number of transactions was lower than a year earlier. Following average price growth of 7.3% last year (broadly similar to that recorded in 2023 and 2024), growth in dwelling prices accelerated to 9.3% in the first quarter of 2026 and remained largely unchanged in the second quarter (9.1%). Prices of existing dwellings were 12.2% higher year-on-year in the second quarter, while the number of transactions fell by 4.4% from a year earlier, when it had increased considerably following several years of decline. Sales of newly built dwellings declined even more markedly year-on-year, by 64.1%, although they accounted for only a small share (3%) of all transactions. Their prices were also lower year-on-year (by 5.8%).
Electricity consumption by consumption group, September 2026
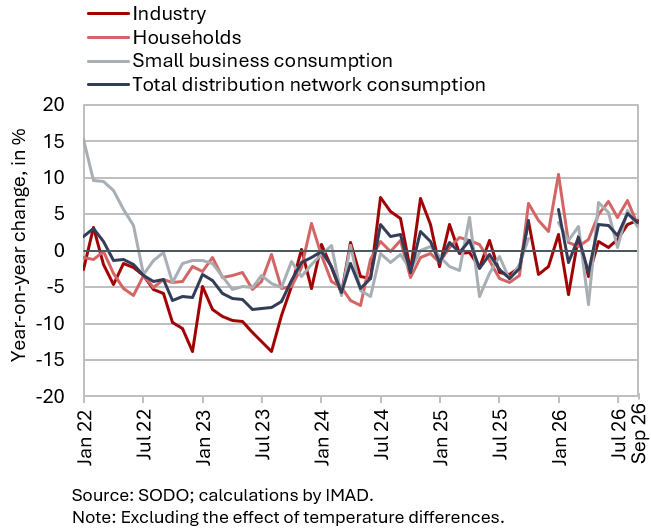
Electricity consumption in the distribution network was 3.8% higher year-on-year in September. Among the main consumer groups, industrial electricity consumption increased by 4.2%, consumption by other business users by 3.3%, and household electricity consumption by 3.6%.
Economic sentiment, September 2026
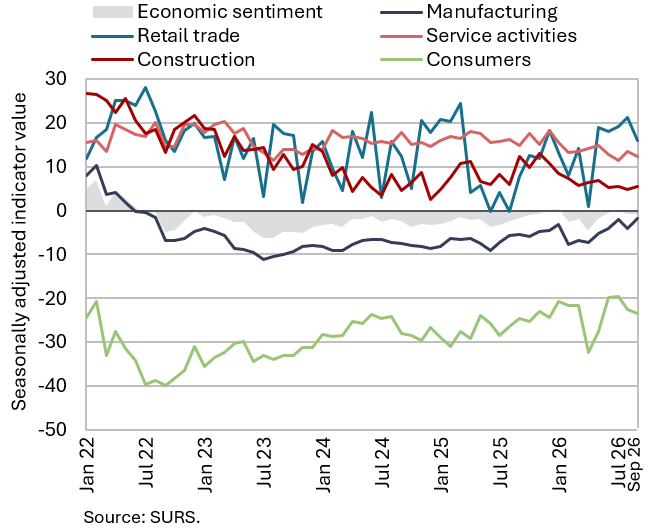
Following a decline in August, the economic sentiment indicator remained largely unchanged in September, thus staying above its level a year earlier and its long-term average. On a monthly basis, only the confidence indicator in manufacturing increased, although it remains below its long-term average. The other confidence indicators mostly declined month-on-month, while the confidence indicator in construction, which has been lower year-on-year since the end of the first quarter of 2026, was the only one to remain unchanged. The confidence indicator in services has also been lower year-on-year since the beginning of the year.
Households facing financial distress, September 2026
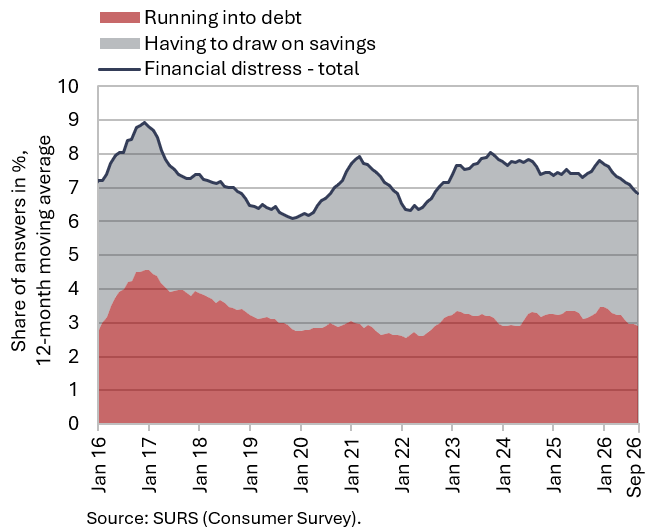
The financial situation of households experiencing financial distress improved year-on-year in the third quarter; quarter-on-quarter, it deteriorated only for households in the lowest income quartile. Among households facing financial distress, the proportion of those running into debt remained broadly unchanged from the previous quarter, while the share of those having to draw on savings to meet their needs increased slightly. Both shares were somewhat lower year-on-year.
Compared with the previous quarter, the share of households experiencing financial difficulties increased markedly only in the lowest income quartile (by 4.8 p.p. to 13.9%), where it remained broadly unchanged from a year earlier. In the second and third income quartiles, however, the share declined.
Number of persons in employment, August 2026
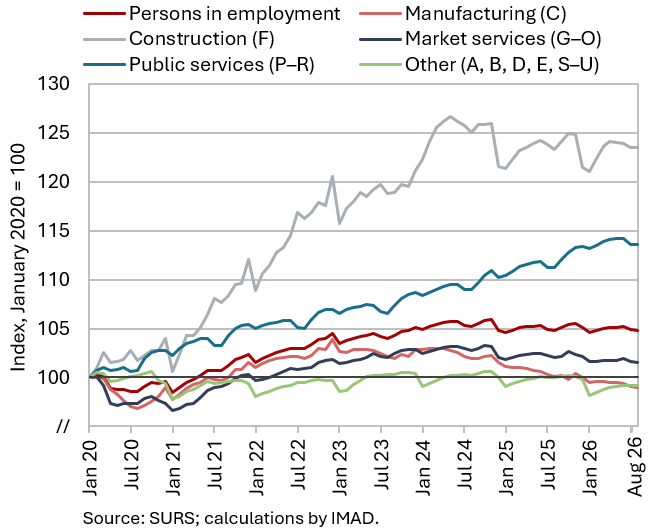
The number of persons in employment was again similar to a year earlier in August, although developments continued to vary considerably across sectors. In the private sector, employment declined year-on-year particularly in labour-intensive activities, especially trade (–1.4%) and manufacturing (–1.1%), with the decline in the latter gradually moderating in recent months. Employment increased particularly in professional, scientific and technical activities (0.8%). In public service activities, the number of persons in employment continued to increase, most notably in human health and social work activities (3.4%). The total number of persons in employment continues to be supported mainly by growth in the employment of foreign nationals (3.4% year-on-year), which has gradually strengthened since the beginning of the year, while the number of Slovenian nationals in employment continues to decline (–0.6%). Labour shortages remain one of the main constraints on business activity, particularly in construction and service activities.
Number of registered unemployed persons, September 2026
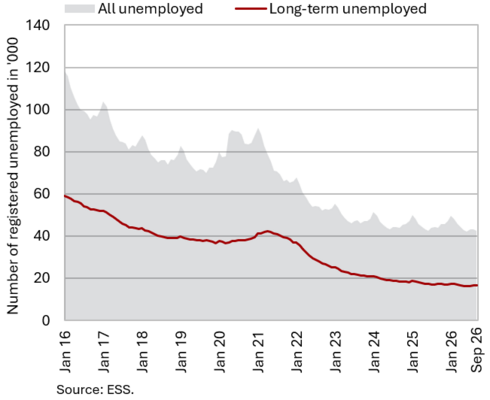
The number of registered unemployed continued to decline in September (by 0.5%, seasonally adjusted), with the decline in recent months somewhat faster than in the first half of the year. With inflows remaining broadly unchanged, the decline was driven by a somewhat larger overall outflow from the unemployment register, mainly reflecting a higher number of deregistrations for reasons other than employment (e.g. failure to comply with obligations and voluntary deregistration). Outflows into employment remained broadly unchanged. At the end of September, 42,439 people were registered as unemployed, 3.4% fewer than in the same month last year. The number of unemployed young people (aged 15–29) was lower year-on-year for the second consecutive month (8,862 persons were registered as unemployed in September, 2.5% fewer than a year earlier). The number of long-term unemployed was also lower (by 3.2%), as was the number of unemployed persons aged 50 and over (by 5.2%).
Average real gross wage per employee, July 2026
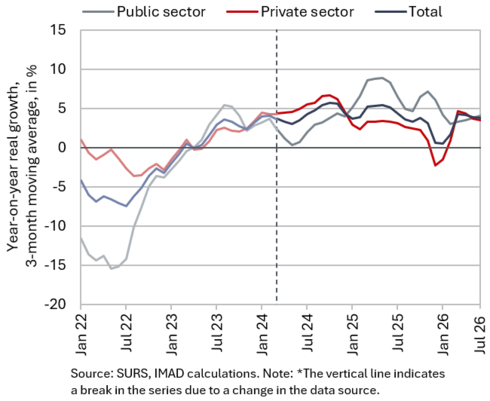
Year-on-year nominal growth in the average gross wage was slightly lower in July (7.6%) than in June, but remained relatively high. This was largely attributable to stronger wage growth in the public sector (8.4%), related to the payment of the third instalment of the basic salary increase (paid in June). In the private sector, year-on-year wage growth also remained relatively high (7.0% in July), amid stronger economic growth and labour shortages. Across activities, wage growth was highest in construction (9.2%).
In the first seven months of 2026, the overall average gross wage increased by 7.3% in nominal terms (4.2% in real terms) – by 7.1% in the public sector (4.0% in real terms) and by 7.2% in the private sector (4.1% in real terms).
Number of FSA beneficiaries and UB recipients, August 2026
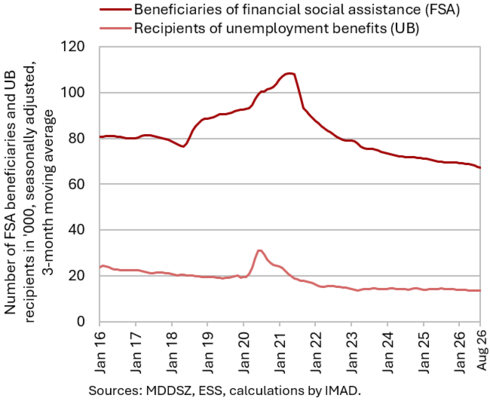
The number of unemployment benefit (UB) recipients and the number of financial social assistance (FSA) beneficiaries declined again year-on-year in August. A total of 13,028 unemployed people received unemployment benefits, 6.5% fewer than a year earlier. Their share of all unemployed persons was 30.1% (compared with 31.4% in August last year). With the continued decline in the number of long-term unemployed persons, who are often eligible for FSA, the number of FSA beneficiaries also decreased further. In August, 65,974 persons were eligible for FSA, 3.6% fewer than a year earlier, representing a slightly greater decline than in recent months.
Consumer prices, September 2026
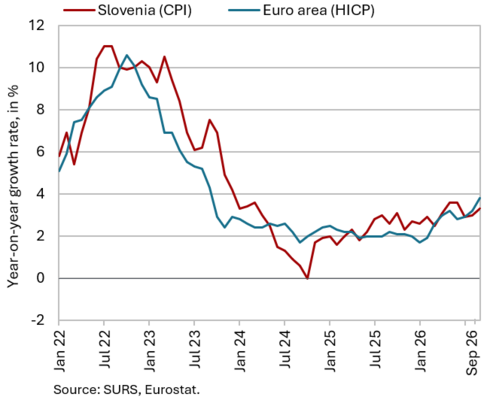
Year-on-year growth in consumer prices strengthened again in September, from 3.0% to 3.3%, while prices fell by 0.1% month-on-month. The contributions to year-on-year inflation from the two groups that include petroleum products increased again, as prices of these products rose somewhat more markedly in September. The transport group (motor fuels) and the housing, water, electricity, gas and other fuels group (heating oil) thus contributed 2.1 p.p. to year-on-year inflation. Services price growth slowed slightly for the third consecutive month but remained relatively high at 4.1%. Somewhat stronger seasonal factors have contributed significantly to the slowdown in recent months, with prices of package holidays in particular declining by more than usual. Services prices contributed 1.4 p.p. to inflation in September. Prices of semi-durable goods were 0.8% higher year-on-year, while prices of durable goods remained lower (by 1.5%). Prices in the food and non-alcoholic beverages group remained lower year-on-year (-0.7%) following a second consecutive monthly decline (this time by 0.2%). Inflation as measured by the HICP stood at 3.7% in Slovenia, 0.1 p.p. below Eurostat's first estimate for the euro area.
Slovenian industrial producer prices, August 2026
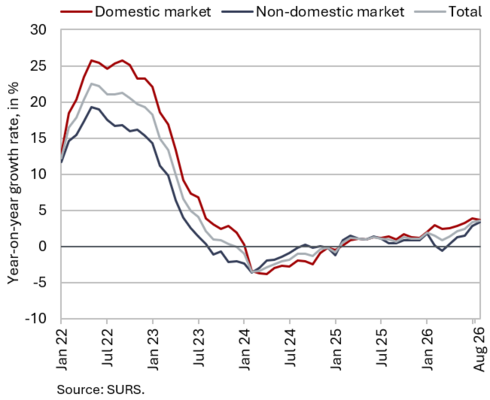
Year-on-year growth in Slovenian industrial producer prices continued to increase in August (to 3.5%), reaching the highest level in the past three years. Prices were higher year-on-year across all industrial groups, with growth driven mainly by intermediate goods prices, which rose by 5.8%, particularly due to a 14.9% increase in prices in the manufacture of basic metals. Prices in this activity have risen by 9.0% over the last four months. Price growth in the other main industrial groups was less pronounced. Prices of energy and capital goods were 2.6% and 2.4% higher year-on-year respectively, while growth in consumer goods prices slowed to 1.0%. The gap between price growth on the domestic market (3.7%) and on foreign markets (3.4%) narrowed further in August. Prices of products sold on euro area markets are rising faster (3.9%), while prices on non-euro area markets are following with a lag (2.0%).
Loans to domestic non-banking sectors, August 2026
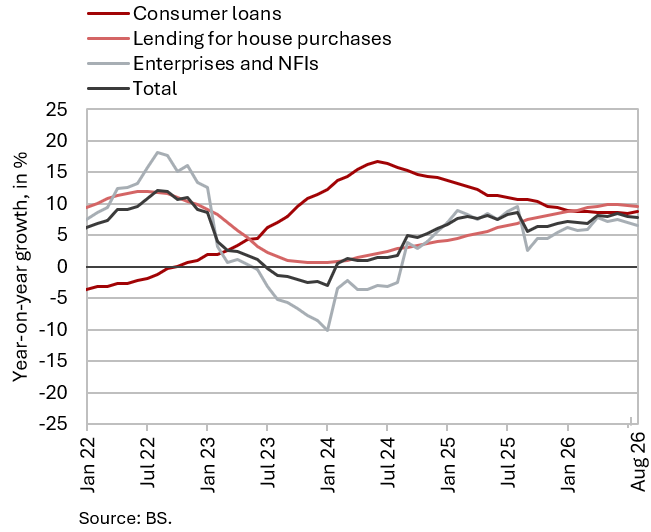
Year-on-year growth in loans to domestic non-banking sectors has remained relatively stable since the beginning of the second quarter, standing at 7.9% in August. The largest contribution came from growth in loans to households (8.2%), with consumer loans (8.8%) and housing loans (9.6%) growing at similar rates. Growth in loans to enterprises and non-monetary financial institutions (NFIs) slowed somewhat in recent months amid higher lending rates, but remained relatively high (6.6%). Growth in deposits by domestic non-banking sectors also remained stable (5.0%). Amid low deposit interest rates (compared with the euro area), overnight deposits in particular continued to increase. At EUR 36.6 billion, they accounted for more than 80% of all deposits by domestic non-banking sectors. The share of non-performing exposures declined slightly in July (to 1.5%), mainly due to a decrease in non-performing exposures in manufacturing. At EUR 507 million, these accounted for approximately half of all non-performing exposures in the banking system.
Government bonds, Q3 2026
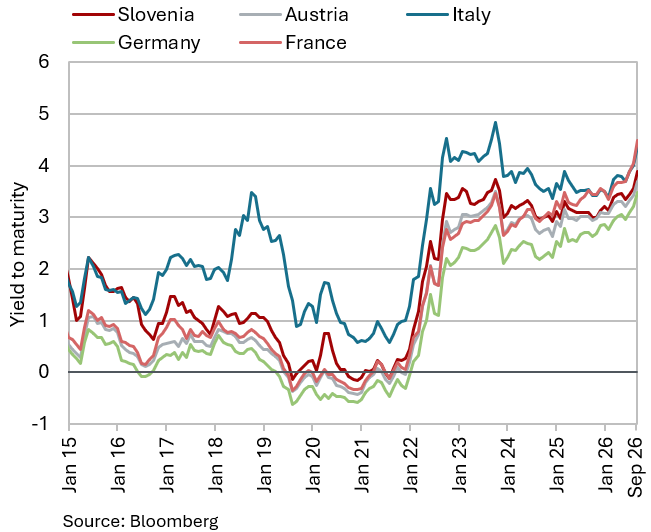
The yield to maturity on the Slovenian government bond rose markedly again in the third quarter, by 21 basis points to 3.63%, and exceeded 4% at the end of the period. Yields to maturity increased markedly across global bond markets. Amid high energy prices and inflationary pressures, the ECB also raised its key interest rates again in the third quarter. Against the backdrop of existing debt levels and additional government measures to mitigate high energy prices, risks to the sustainability of public finances also increased. Despite the marked increase in the yield to maturity on the Slovenian government bond, the spread over the German government bond yield narrowed compared with the second quarter (by 4 basis points), to 37 basis points.
Current account of the balance of payments, August 2026
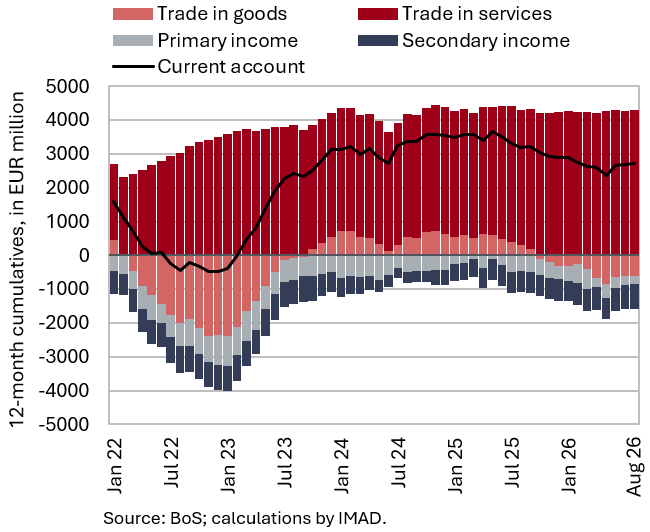
The 12-month current account surplus (up to August) amounted to EUR 2.7 billion (3.6% of estimated GDP), EUR 484.1 million less than in the preceding 12-month period. The largest contribution to this change came from a larger annual goods trade deficit, mainly due to a smaller surplus in trade with non-EU countries. According to IMAD estimates, volume developments contributed EUR 577 million to the deterioration in the trade balance (EUR 917 million), while changes in the terms of trade accounted for EUR 340 million. The secondary income deficit also widened, primarily due to higher contributions to the EU budget based on gross national income and value added tax. The services surplus increased, particularly due to a higher surplus in insurance services, reflecting the expansion of a Slovenian insurance company’s operations and related services in the Italian motor insurance market. The surplus in transport services also increased. The primary income deficit narrowed, mainly due to smaller net outflows of income from equity (dividends and profits), and partly due to higher income earned by Slovenians working abroad.
Revenue (top figure) and expenditure (bottom figure) of the consolidated general government budgetary accounts, August 2026
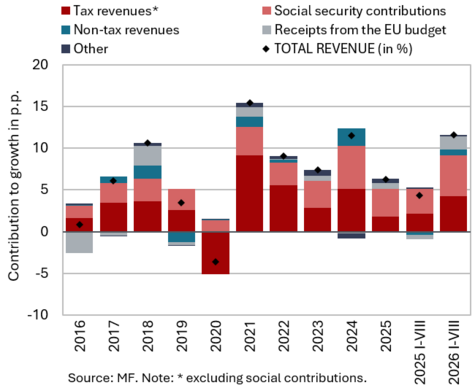
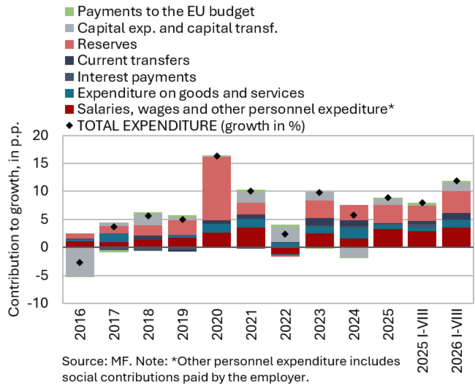
The deficit of the consolidated general government balance was higher year-on-year in the first eight months, amid stronger growth in both revenue and expenditure. It totalled EUR 1.254 billion, compared with EUR 1.066 billion in the same period last year. Revenue was 11.6% higher year-on-year (compared with 4.3% in the same period last year), mainly due to growth in social contributions (particularly the long-term care contribution, which was introduced in July last year) and tax revenue. Amid strengthening economic activity, revenue from value added tax and corporate income tax contributed the most to the increase in tax revenue. Revenue from EU funds also increased significantly, mainly for the implementation of the Recovery and Resilience Plan (RRP), but also from the European Structural Funds. Expenditure increased by 11.9% year-on-year (by 8% in the same period last year). The largest contributions to expenditure growth continued to come from compensation of employees (reflecting the implementation of the public sector pay reform) and transfers to individuals and households. Among the latter, expenditure increased particularly on pensions, unemployment benefits (which were raised at the beginning of this year) and personal assistance. Transfers for the provision of public scheduled passenger transport services under new concessions, transfers to non-profit organisations and institutions, kindergarten subsidies, sickness benefits, and transfers to war invalids, veterans and victims of war violence were also higher. Growth in investment expenditure strengthened, particularly for new construction, reconstruction and renovation works, the purchase of computer hardware and licensed software, and the modernisation of municipal vehicle fleets (buses). Expenditure on goods and services was also higher year-on-year, mainly due to increased spending on routine maintenance of buildings.
EU budget receipts, August 2026
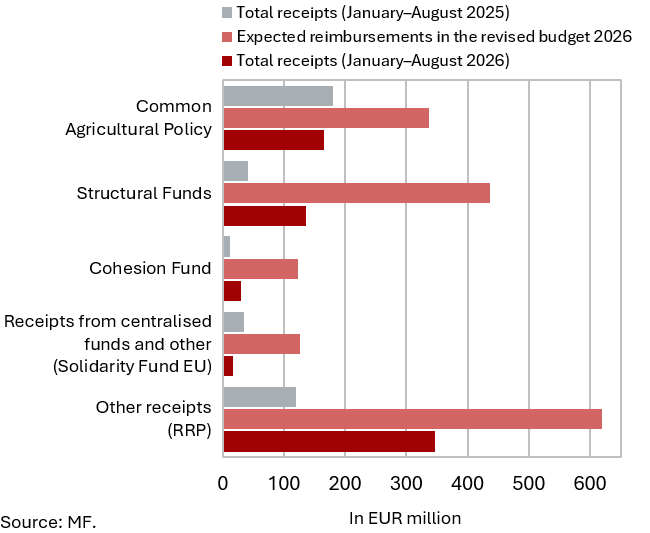
Slovenia’s net budgetary position vis-à-vis the EU budget was positive in the first eight months of 2026 (EUR 132.9 million). Slovenia received EUR 694.6 million from the EU budget, EUR 306 million more than in the same period last year, while its contributions amounted to EUR 561.6 million, EUR 86 million more than a year earlier. Receipts under the Recovery and Resilience Plan (RRP) again contributed the most to the increase in revenue (EUR 347 million), while receipts from the Structural Funds (EUR 136.4 million) and the Cohesion Fund (EUR 30.1 million) were also significant. Under the European Cohesion Policy Programme 2021–2027, approximately EUR 160 million had been disbursed by the end of August, while a further EUR 325 million will need to be certified by the end of the year. In the first eight months, receipts under the RRP amounted to 56% of the funds envisaged in the revised state budget for 2026. Since the start of the implementation of the RRP, Slovenia had received EUR 1.81 billion, or 87% of the available funds, by the end of August this year (EUR 1.344 billion in grants and EUR 466 million in loans). By that time, approximately 90% of the available RRP funds had been disbursed.